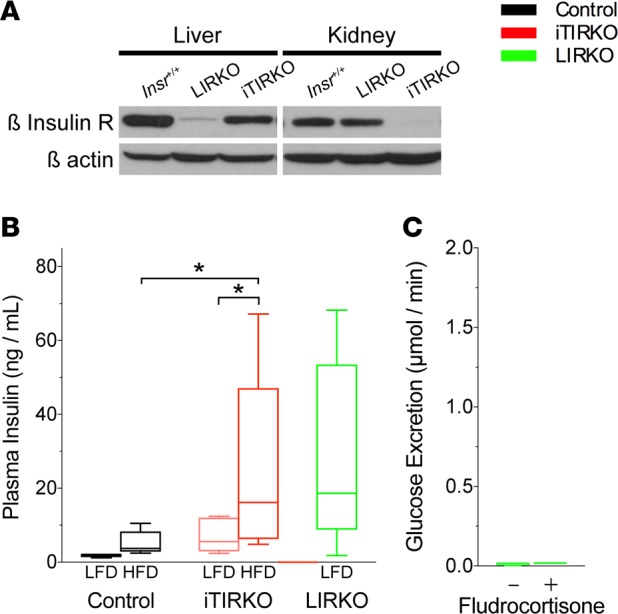
Figure 4. Liver insulin receptor–KO (LIRKO) increases insulin resistance but does not cause glucosuria.

(A) Representative immunoblot of whole kidney from control (Insr+/+, n = 3), LIRKO (n = 3), and iTIRKO (n = 3) mice probed for β insulin receptor and then stripped and reprobed for β-actin. (B) Fasting plasma insulin concentration from high -sodium–, low-fat–fed control (n = 5) and high-fat–fed control (n = 8); low fat-fed (n = 5) and high-fat–fed (n = 9) iTIRKO; and low-fat–fed LIRKO (n = 10) mice. (C) Urinary glucose excretion rate in fludrocortisone-treated (n = 4) and untreated (n = 4) LIRKO mice. Control represents age-matched littermates of iTIRKO mice. iTIRKO, inducible renal tubular insulin receptor–KO mice. *P < 0.05 by 2-way ANOVA with Bonferroni correction for multiple comparisons. In box and whisker plots, the whiskers represent minimum and maximum values, and box borders represent the 25th percentile, median, and 75th percentile.
