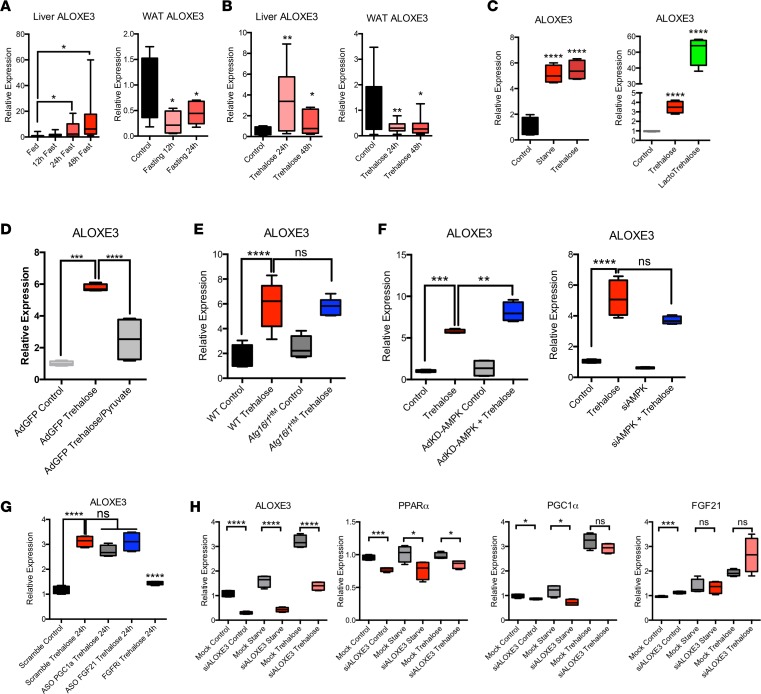
Figure 1. Aloxe3 is induced in response to fasting and pseudofasting.
(A) Aloxe3 expression in liver and white adipose tissue (WAT) from fasting WT mice (0–48 hours [h]). n = 6 each of fed, 12 h fasting, and 24 h fasting mice. For 48 h fasting mice, n = 7. (B) Aloxe3 expression in WT mice fed oral trehalose (3% in sterile water fed ad libitum, 0–48 h). For control and trehalose (24 h) mice, n = 5 and 6. For 48 h trehalose-treated mice, n = 6. (C) Aloxe3 expression in isolated primary murine hepatocytes treated with 0.5% FCS/1 g/l glucose media, 100 mM trehalose, or 100 mM lactotrehalose (24 h). n = 4 per group. (D) Aloxe3 expression in trehalose-treated isolated primary hepatocytes pretreated with or without 5 mM pyruvate. n = 4 per group. (E) Aloxe3 expression in trehalose-treated WT and Atg16l1-mutant mice in vivo (24 h). n = 6 per group. (F) Aloxe3 expression in response to trehalose in the presence or absence of kinase-dead AMPK overexpression or siRNA-mediated AMPK knockdown. n = 4 per group. (G) Aloxe3 expression in response to trehalose in the presence or absence of antisense oligonucleotide (ASO) directed against PGC1, or FGF21. FGF receptor 1–4 inhibitor (LY2874455) was included as a control to demonstrate Aloxe3 blockade in context. n = 4 per group. (H) Fasting-responsive marker gene expression in the presence or absence of trehalose following treatment with or without Aloxe3-directed siRNA. *P < 0.05, **P < 0.01, ***P < 0.001, and ****P < 0.0001 by 2-tailed t test with Bonferroni-Dunn post hoc correction versus untreated controls group or versus the bracketed comparison group where indicated.

