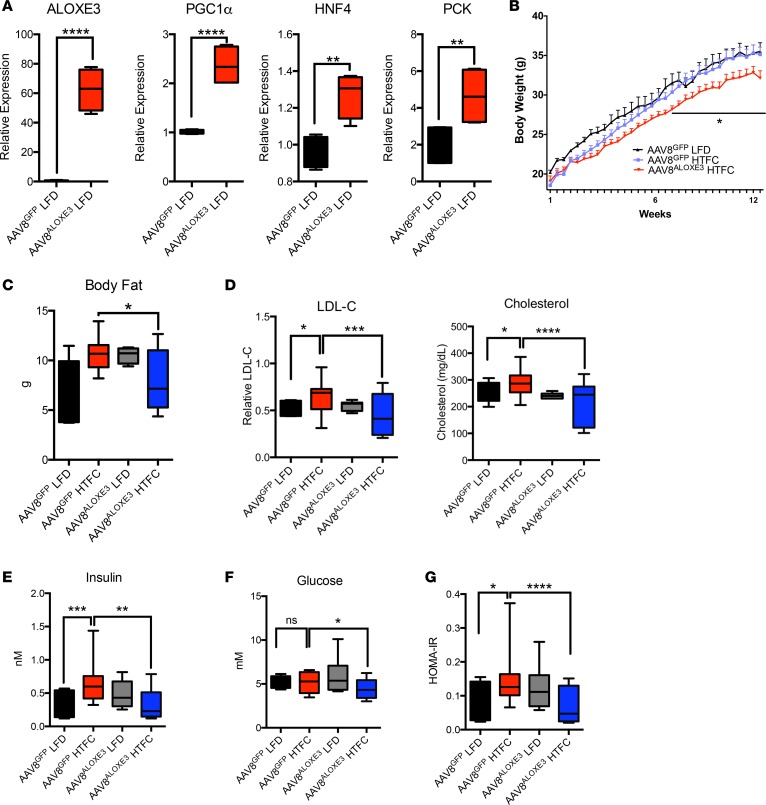
Figure 4. Enhanced whole-body metabolism in mice ALOXE3-overexpressing mice.
(A) qPCR quantification of expression for oxidative and fasting-response genes in unperturbed mice expressing hepatocyte GFP or Aloxe3. (B) Body weight over time in low-fat or high–trans fat/cholesterol diet–fed mice expressing hepatocyte GFP or Aloxe3. (C) Body fat content in mice fed HTFC or LFD with or without hepatic Aloxe3 overexpression. (D) LDL-C and total cholesterol in mice fed HTFC or LFD with or without hepatic Aloxe3 overexpression. (E–G) Circulating insulin, glucose, and calculated HOMA-IR in LFD- and HTFC-fed mice overexpressing hepatocyte GFP or Aloxe3. Number of mice in each group is: 5, AAV8GFP LFD; 10, AAV8GFP HTFC; 5, AAV8ALOXE3 LFD; and 10, AAV8ALOXE3 HTFC. *P < 0.05, **P < 0.01, ***P < 0.001, and ****P < 0.0001 by 2-tailed t test with Bonferroni-Dunn post hoc correction versus the bracketed comparison group as indicated.

