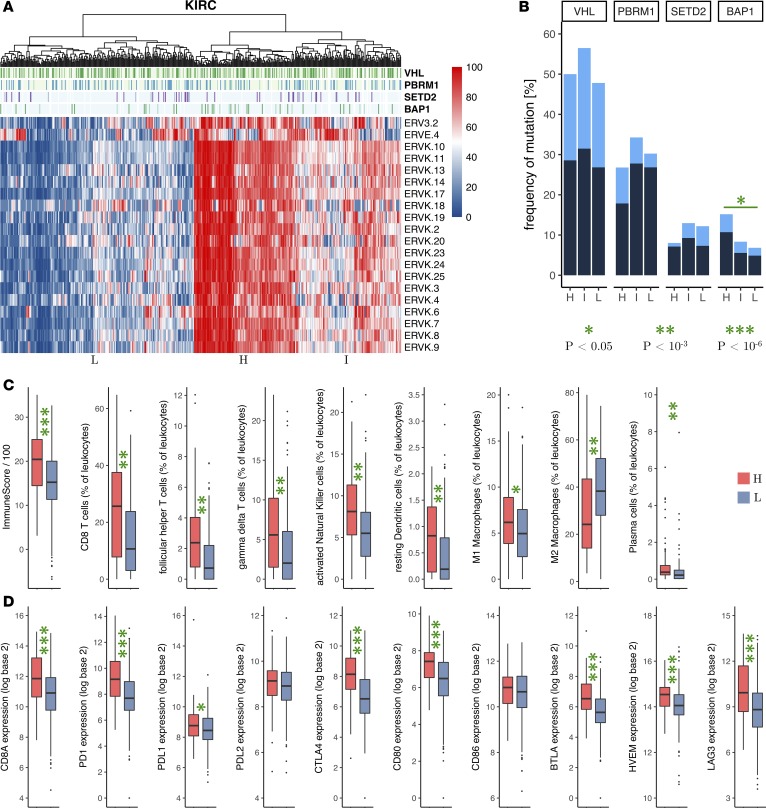
Figure 2. Expression of πERVs defines subtypes with differential immune checkpoint activation in ccRCC (KIRC).
(A) Hierarchical clustering of tumors from TCGA (columns) by expression (percentile) of πERVs (rows) stratifies tumors into 3 subtypes (high [H], intermediate [I], and low [L]). (B) Frequency of VHL, PBRM1, SETD2, and BAP1 mutations (dark, truncating mutations; light, other nonsynonymous mutations) in the 3 subtypes. Comparison of (C) overall immune infiltration in tumors (“ImmuneScore”) and fractional composition of tumor-infiltrating leukocytes and (D) mRNA expression of CD8A (cytotoxic T cell marker) and immune checkpoint genes between πERV-high and πERV-low subtypes. Number of samples: (C) ImmuneScore (119 H, 228 L), all other categories (90 H, 134 L), (D) 119 H and 228 L. P values reported in bar plots and box plots are from Fisher’s exact test and Wilcoxon rank-sum test, respectively (all 2 sided). *P < 0.05, **P < 10–3, ***P < 10–6.

