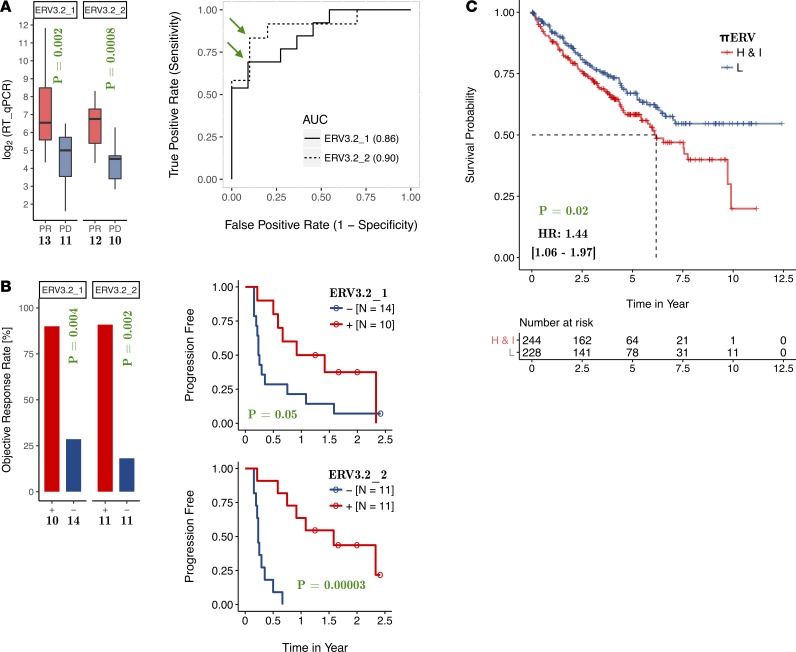
Figure 3. RNA expression of ERV3-2 predicts the response to immune checkpoint blockade in ccRCC.
(A) Expression of ERV3-2 is significantly higher in tumors from responders compared with tumors from nonresponders and is an excellent predictor of response to immune checkpoint blockade for both primers. Green arrows mark the optimal cutoffs that were subsequently used to stratify patients into ERV3-2+ or ERV3-2− groups for consistency checks. (B) The ERV3-2+ group has significantly higher objective response rates and longer progression-free survival compared with the ERV3-2− group for both primers. (C) In contrast, πERV-high/intermediate subtypes have shorter overall survival under standard therapy compared with πERV-low subtype in TCGA ccRCC (KIRC) cohort. The number of samples is specified in each panel. P values reported in bar plots, box plots, and Kaplan-Meier plots are from Fisher’s exact test, Wilcoxon rank-sum test, and log-rank tests, respectively (all 2 sided).

