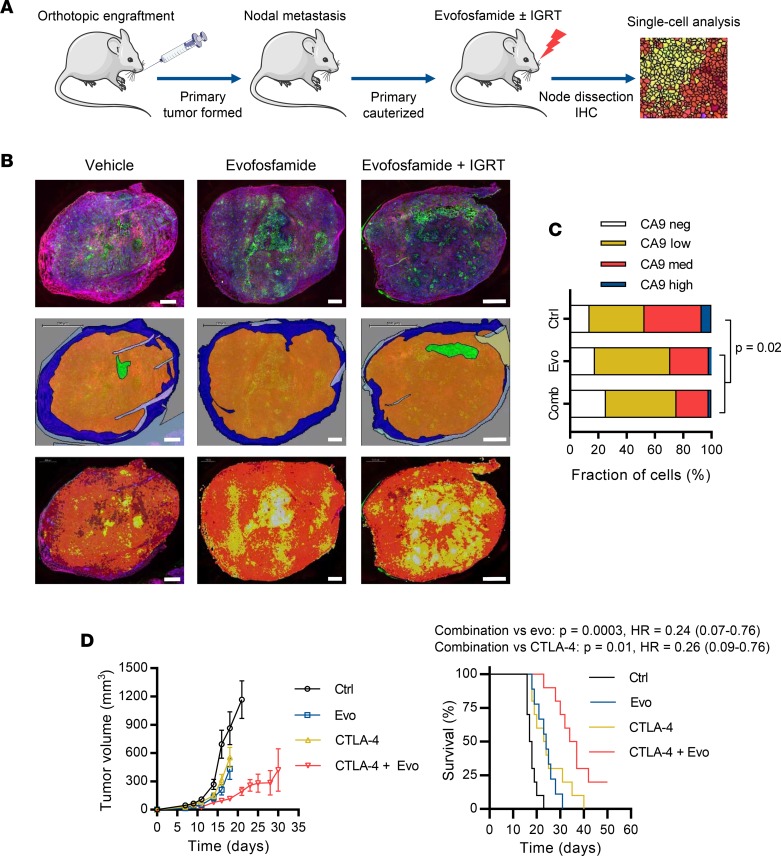
Figure 7. Evofosfamide reduces nodal hypoxia and augments CTLA-4 blockade in head and neck squamous cell carcinoma (HNSCC) tumor models.
(A) Experimental design for assessing target engagement (as a reduction in the CA9-positive hypoxic tumor cell fraction) in nodal lesions disseminated from an orthotopic UT-SCC-74B tumor model. (B) Definiens TissueStudio analysis of CA9 staining in nodal lesions from treated and control animals. The top row shows CA9 staining (red), pan-cytokeratin staining (green), and DAPI staining (blue) in representative sections from each treatment group. The middle row shows tissue segmentation into tumor (orange), normal tissue (blue), necrosis (green), and artifact (gray). The bottom row shows the cellular classification, in which individual cells (identified by DAPI staining) are assigned 1 of 4 categories according to CA9 expression: negative (white), low (yellow), medium (orange), or high (red). Scale bars: 200 μm. (C) Comparison of the proportion of viable tumor cells showing negative, low, medium, or high expression of CA9 in nodal lesions dissected from animals treated with control vehicle (n = 2), evofosfamide monotherapy (evo, n = 3), or evofosfamide plus image-guided radiotherapy (IGRT; comb, combination n = 3) was analyzed using machine learning in the Definiens TissueStudio environment. Statistical significance of the reduction in CA9 staining in treated tumor sections was assessed by χ2 test. (D) Efficacy of evofosfamide (50 mg/kg i.p. qd × 5 weekly for 2 cycles interspaced by 1-week treatment holiday) alone or with concurrent anti–CTLA-4 antibody (9H10, 100 μg/dose i.p. q3d × 3 weekly) in the syngeneic HNSCC model, SCC-7. The tumor growth plot (left panel) shows the mean ± SEM tumor volume for 10 animals per treatment group. Survival analysis (right panel) used log-rank tests with time to tumor volume ≥1,000 mm3 to define events. HR, hazard ratio.

