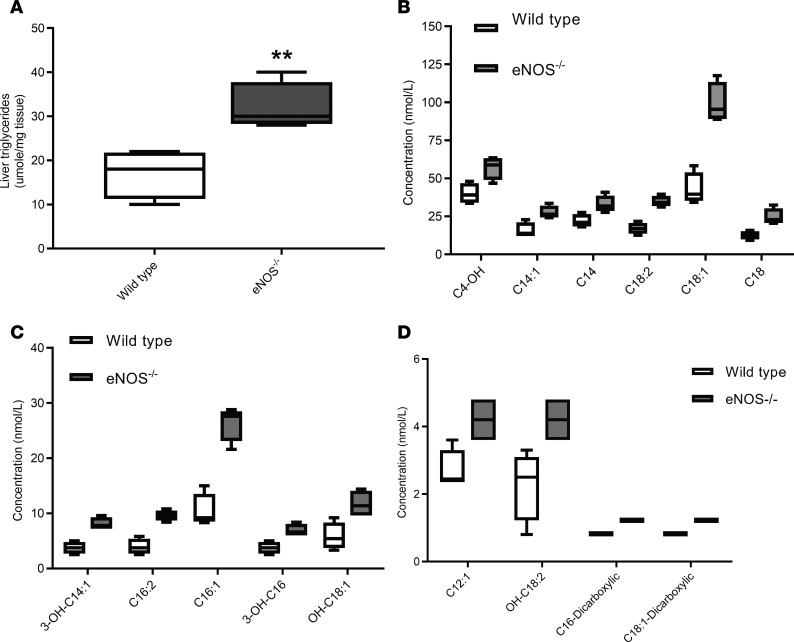
Figure 3. Fasting induced increased liver triglycerides and increased circulating acylcarnitines in 4-month-old eNOS–/– mice.
(A) Liver triglyceride levels after 20 hours of food withdrawal. Box-and-whisker plots show median, 25th and 75th percentiles, and minimum and maximum values (n = 4). Data were analyzed by 1-way ANOVA, **P < 0.01. (B–D) Circulating levels of acylcarnitines that are significantly elevated in the sera of eNOS–/– mice (gray boxes) as compared with wild-type (white boxes) mice after 20 hours of fasting. Box-and-whisker plots show median, 25th and 75th percentiles, and minimum and maximum values (n = 4). Data were analyzed by 1-way ANOVA, P < 0.05.

