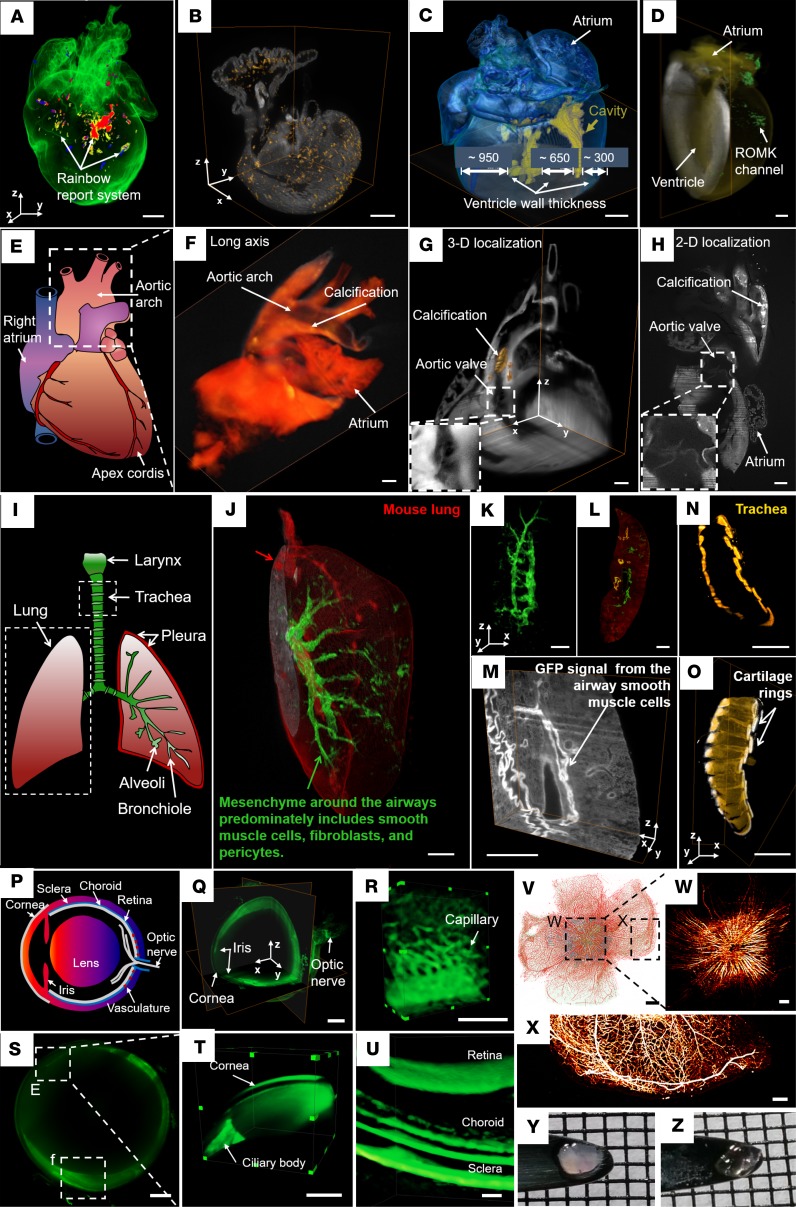
Figure 3. Three-dimensional interrogation of cardiovascular development and regeneration in neonatal and adult mouse models.
(A and B) Cardiac progenitor lineage tracking in neonatal mouse hearts. Cre expression leads to cerulean, GFP, mOrange, and mCherry expression (A). Spatial distribution of tdT+ cells (hot) in a neonatal heart from a Mesp1Cre/+ mouse crossed with the Rosa26tdT/+ reporter line (B). (C) The reconstructed heart reveals the small ventricular cavity (yellow) in a thick wall at P7. (D) Detection of GFP-tagged renal outer medullary potassium (ROMK) channel (green) in a 7.5-month-old adult mouse heart. (E–H) Calcific vasculopathy in a mouse atherosclerosis model. Illustration of cardiac anatomy delineating the areas imaged, including the heart base and aortic arch (E). Three-dimensional reconstruction shows calcium mineral (yellow) in a 15-month-old female apolipoprotein-deficient mouse (F). A 3-D orthogonal slice (G) and 2-D raw data (H) show distribution of aortic calcium mineral (brown and white, respectively). (I–O) Three-dimensional localization of developing mesenchyme from an 8-week-old reporter mouse lung. Cre expression (mGFP, green) was detected in lung mesenchymal cells, including airway, vascular smooth muscle cells, a variety of fibroblasts, vascular endothelial cells, and pericytes. Cre-negative cells expressed mTomato (red) (I–K). Two-dimensional (L) and 3-D (M) raw data of airway smooth muscle cells with high GFP. Tracheal architecture is visualized by the C-shaped rings (yellow) of hyaline cartilage (N and O). (P–Z) Label-free imaging of an intact albino mouse eye and fluorescence imaging of an rd10 eye using light-sheet microscopy. Illustration of a mouse eye includes the lens, cornea, sclera, choroid, retina, iris, and optic nerve (P). Light-sheet microscopy captured the 3-D orthogonal slice of the entire eyeball without changing the objective lens (Q). Three-dimensional vascular network in the posterior ocular system (R). Two-dimensional (S) and 3-D (T) structure of the cornea and ciliary body. Three-dimensional reconstruction of multilayer images reveals the retina, choroid, and sclera (U). The rd10 mouse is a model of autosomal recessive retinitis (V–X). Bipolar and ganglion cells express GFP (blue), while amacrine cells and vasculature are labeled with Alexa 594 (red) (V). Maximum intensity projection (MIP) images are presented in single-channel neurons expressing GFP (W) and single channel of vasculature labeled with Alexa 594 (X). Retina prior to (Y) and after (Z) simplified CLARITY are presented. Scale bars: 500 μm (A–D, Q, S–V); 1 mm (F–O); 200 μm (R, W and X). (Reproduced with permission from refs. 21, 83, 88.)

