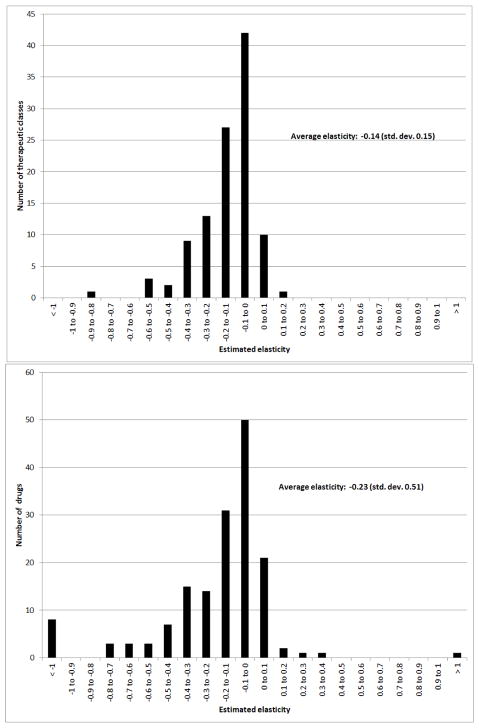
Figure 4. Distribution of elasticity estimates.
Figures show the distribution of the estimated elasticities across the 108 “common” therapeutic classes (top panel) and 160 “common” drugs (bottom pane). Appendix Tables A14 and A15 report the complete list.

