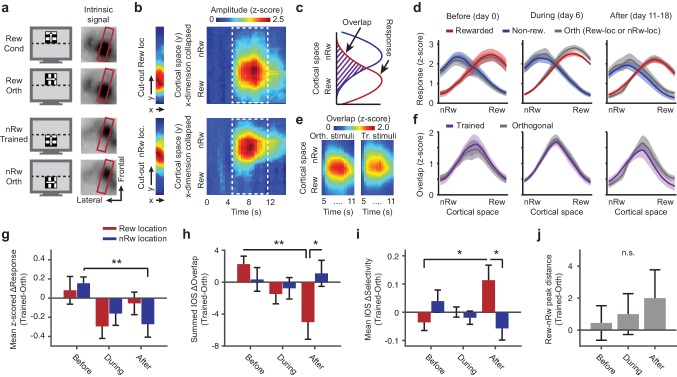
Figure 2. Repeated imaging of intrinsic optical signals in V1 of mice subjected to conditioning.
(a) Visual stimuli (left panels) and average stimulus-induced intrinsic optical signal (IOS; right panels), showing strong retinotopically selective responses to the rewarded and non-rewarded location in area V1 (within red boundary) and weaker responses in the lateral supplementary visual areas LM and AL (to left of red box). Orth, orientation orthogonal to trained orientation (Cond). (b) Left panels: Example of 11-pixel wide cutout from the red box in a, that was automatically rotated so as to include the cortical area of maximal activation for both the top and bottom stimulus location. Right panels: The IOS response to each stimulus as a function of cortical space (maximally separating the top and bottom stimulus) and time (derived from the 11-pixel wide cutouts by collapsing the ‘x’ dimension per imaging frame and concatenating time points). Upper panels: Response to rewarded location and orientation. Lower panels: Response to non-rewarded location and orientation. (c) Schematic showing quantification of the response amplitude and overlap of cortical responses to visual stimuli in adjacent retinotopic locations. (d) Mean ± SEM z-scored amplitude of the IOS response (across the period of maximum activation, 7 to 11 s) as a function of cortical space along the axis that maximally separates the rewarded and non-rewarded stimulus. Red: Rewarded stimulus; Blue: Non-rewarded, trained stimulus; Grey: Orthogonal orientations at the rewarded or non-rewarded location respectively. Left panel: Data acquired before the first conditioning session (day 0; IOS1, see also Figure 1e). Middle panel: After five conditioning sessions (IOS2). Right panel: Data acquired after the last conditioning session on the same day as, but before, calcium imaging (IOS3). (e) Mean overlap (across all mice) between the response to the orthogonal or trained stimuli in the rewarded and non-rewarded locations as a function of cortical space (y-axis) and time (x-axis). Scale bar above applies for both panels. (f) As in d), but for the overlap between the response to the rewarded and non-rewarded trained stimulus (plotted in Violet). (g) ΔResponse amplitude (difference between trained and control orientations) in the cortical region that responded to the rewarded location (red) and non-rewarded location (blue) separately, across imaging time points (**p=0.0039, Kruskal-Wallis, post hoc WPMSR test). (h) As in g), but for ΔOverlap per region and across imaging time points (*p=0.039, WMPSR test; **p=0.011, Kruskal-Wallis test, post hoc WMPSR test). (i) As in g), but for ΔSpatial selectivity (Rewarded vs. Non-rewarded: *p=0.039, WMPSR test; Before vs. After: *p=0.046, Kruskal-Wallis test). (j) Distance between the peak responses to the spatially segregated stimuli (difference between trained and orthogonal control stimuli, positive values indicate larger distance between trained stimulus representation peaks).


