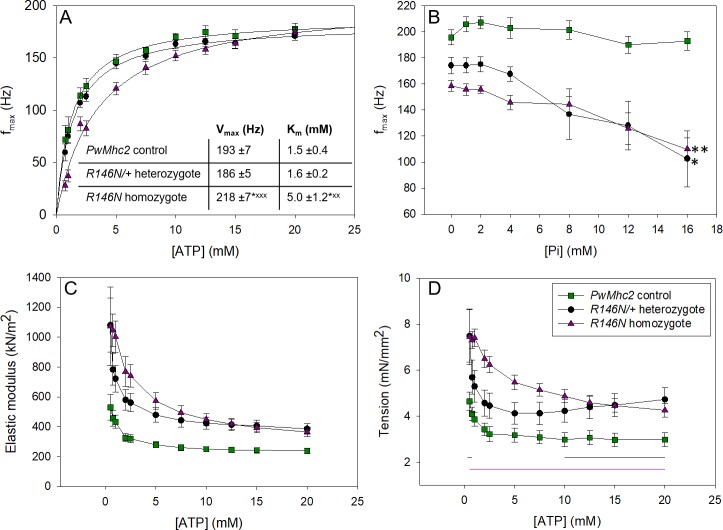
Figure 5. Varying [ATP] and [Pi] reveals information about cross-bridge kinetics.
(A) The frequency at which small amplitude sinusoidal power was maximal, fmax, was measured for a range of ATP concentrations for control (PwMhc2 homozygotes), heterozygous (R146N-15/+) and homozygous (R146N-15/R146N-15) fibers. The curves were fit with the Michaelis-Menten equation and Vmax and Km values determined (see inset). Student’s t-test with p<0.05 significantly different from control (*p<0.05, **p<0.01, ***p<0.001) or heterozygote (xp<0.05, xxp<0.01, xxxp<0.001). (B) fmax relative to inorganic phosphate concentration. fmax decreased with increasing [Pi], suggesting phosphate is competing with ATP for the rigor state. * indicates statistically significant difference from 0 mM Pi (Student’s t-test with p<0.05 significantly different (*p<0.05, **p<0.01). Linear regression analysis showed mutants had a steeper decline of fmax and larger negative slopes than the control. Seven control, 12 heterozygous, and seven homozygous fibers were tested. (C) Change in active stiffness with increasing ATP concentration. In-phase stiffness (elastic modulus) was measured at pCa 5.0 at 500 Hz ML oscillation using small amplitude sinusoidal analysis. All R146N stiffness values are statistically greater than the control’s by a Student’s t-test at p<0.05. (D) Active isometric tension generation as a function of ATP concentration at pCa 5.0. For the ATP study, N = 12 control, 12 heterozygous and 14 homozygous fibers. Black and purple horizontal lines indicate [ATP] where heterozygous and homozygous tension values are statistically greater than control’s (t-test, p<0.05). Full genotypes are shown in parentheses: PwMhc2 homozygote control (P{PwMhc2}/P{PwMhc2}; Mhc10/Mhc10); R146N-15/+ heterozygote (Mhc10/+; P{R146N-15}); R146N-15 homozygote (Mhc10/Mhc10; P{R146N-15}/P{R146N-15}).


