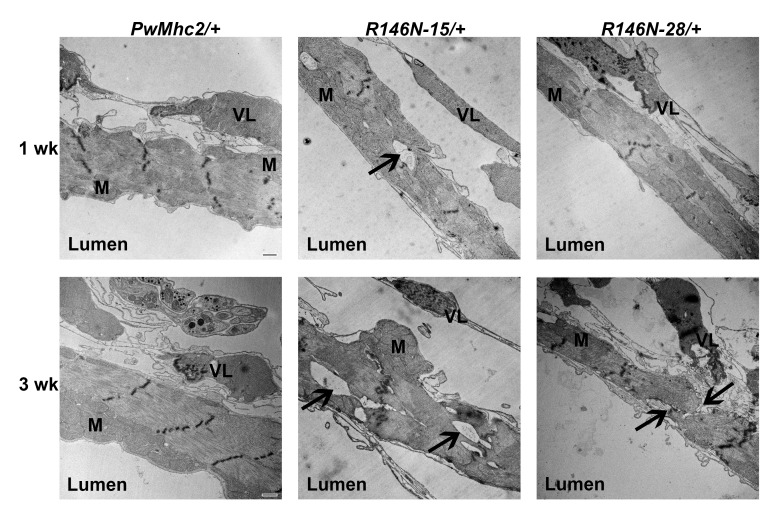
Figure 6. Transmission electron microscopy images of hearts of 1- and 3-week-old PwMhc2/+ control and R146N/+ mutant heterozygote lines.
Micrographs show transverse images through the cardiac tube between the second and third sets of ostia. M, mitochondria. VL, supportive ventral-longitudinal fibers. ‘Lumen’ refers to the hemolymph-containing center of the heart tube. Arrows indicate areas of myofibrillar discontinuities, which are only observed in mutant hearts. Scale bars, 500 nm. Full genotypes are shown in parentheses: PwMhc2/+ (P{PwMhc2}; Mhc1/+); R146N/+ (Mhc1/+; P{R146N}).

