
Author response image 1. Graphs show absolute expression of BMP4 and BMP2 in VN (green) and non-VN (red) at 6 and 10 dpl, dots represent expression level for each sample.
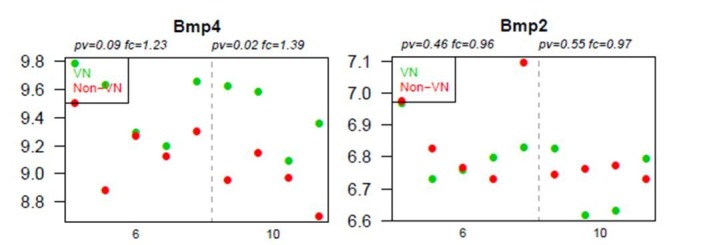
The Y axis represents gene expression, log2; X axis – dpl.
Official websites use .gov
A
.gov website belongs to an official
government organization in the United States.
Secure .gov websites use HTTPS
A lock (
) or https:// means you've safely
connected to the .gov website. Share sensitive
information only on official, secure websites.
The Y axis represents gene expression, log2; X axis – dpl.