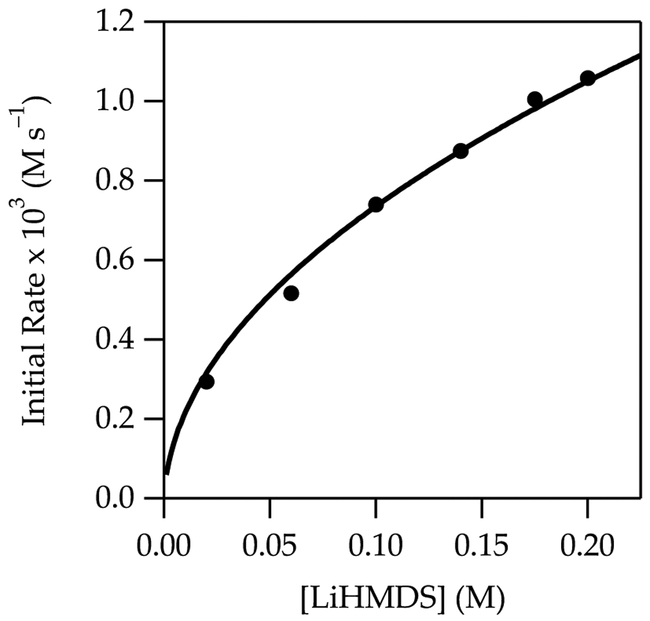
Figure 8.
Plot of initial rate vs LiTMP concentration in hexane for the metalation of 4 (0.010 M) at –40 °C measured with IR spectroscopy (1655 cm–1). The curve depicts an unweighted least-squares fit to eq 12 that accounts for the shifting dimer–monomer mixtures described by eq 4. A simple fit to y = axn affords a = 2.7 ± 0.1, n = 0.57 ± 0.02.

