
Fig. 2. SVM classification for college football.
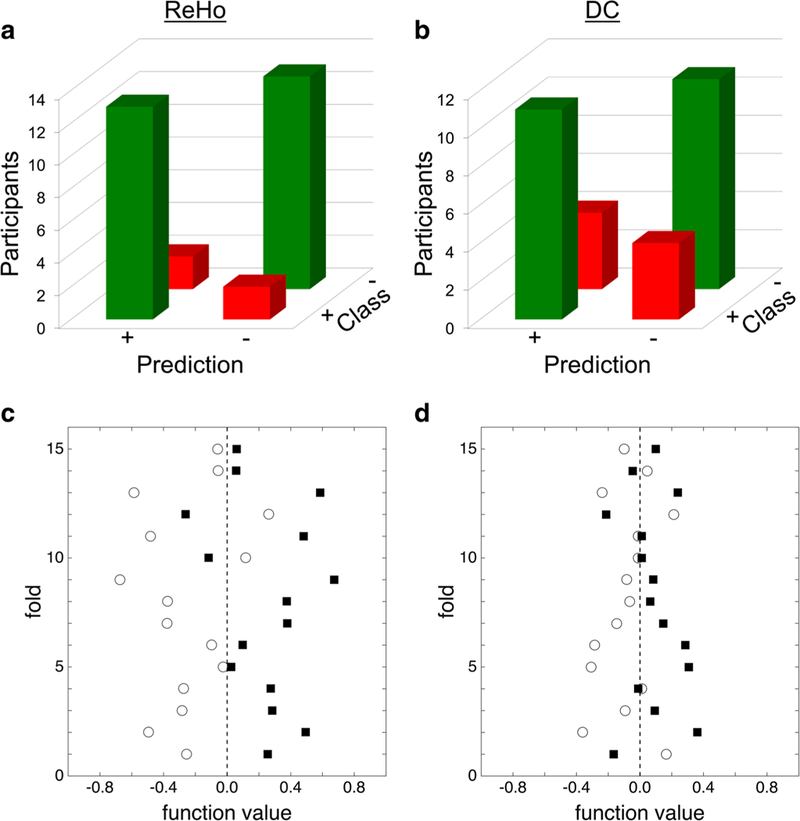
College football’s SVM classification confusion matrix for ReHo (a) and DC (b) depict the number of correct and incorrect predictions for each class (ex. ΔReHo vs -ΔReHo). The SVM prediction plot for ReHo (c) and DC (d) shows result of the SVM decision function for each participant. Dotted line at zero represents the decision threshold which is zero-centered by the paired nature of the SVM. Closed black squares represent metric difference maps (ex. ΔReHo) and open circles represent their opposite (ex. -ΔReHo). ReHo regional homogeneity, DC degree centrality