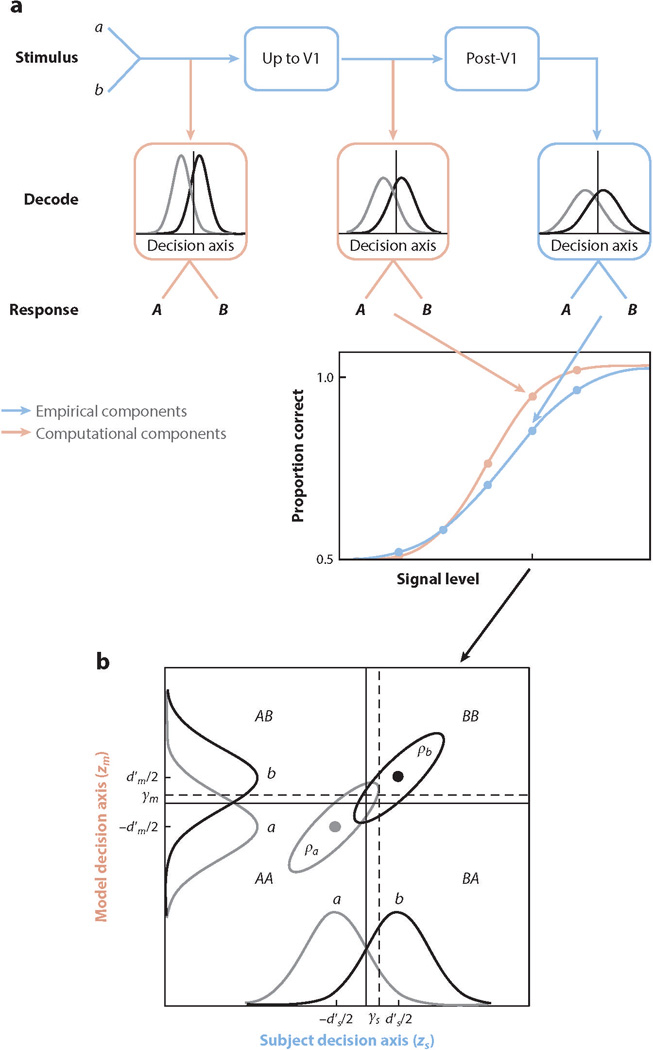
Figure 3.

Decoders in a two-alternative identification task. (a) In the signal detection theory (SDT) framework, a decoder takes the input signal on each trial and computes the value of a scalar decision variable—nominally, the log of the ratio of the probability of stimulus b to the probability of stimulus a, given the specific input signal received on that trial. If the value of the decision variable exceeds a decision criterion γ (represented by the vertical lines in the boxes), then the observer reports that the stimulus is B; otherwise, that it is A. A model stimulus decoder (first pink box) takes a noisy stimulus as input and generates behavioral responses in the task. A model V1 decoder (second pink box) takes the V1 output as the input and generates behavioral responses in the task. The actual stimulus decoder encompasses all the processing in the stimulus-to- behavior pathway (all blue boxes). The actual V1 decoder encompasses all processing subsequent to V1 (last two blue boxes). In a typical experiment, performance is measured as function signal level (difference between stimulus categories a and b). Proportion correct as function of signal level for an arbitrary model decoder is a neurometric function (pink data points) and, for the subject, is a psychometric function (blue data points). (b) SDT also provides a framework for analyzing trial-by-trial performance at any given signal level (e.g., the level indicated by the tick mark in panel a). The horizontal axis represents the value of the subject’s decision variable, and the vertical axis represents the value of a model’s decision variable (see Sebastian & Geisler 2018 for more details; see also Michelson et al. 2017). The Gaussians on each axis represent the distributions of the decision variable (normalized to a standard deviation of 1.0) for the two stimulus categories (a and b). The ellipses represent the joint (bivariate) distribution of the decision variables for the two stimulus categories. The bivariate distributions are completely described by four parameters: the subject’s level of discriminability (referred to as ) ( ), the model decoder’s level of discriminability ( ), and the decision-variable correlations and . The four quadrants defined by the decision criteria (dashed lines) represent the different possible pairs of responses (the first letter is the response of the subject, and the second is the response of the model). The eight proportions of these response pairs, corresponding to the four quadrants for each of the two stimulus categories (a and b), uniquely determine the discriminabilities of the subject and model (), the decision criteria of the subject and model (), and the decision-variable correlations ().
