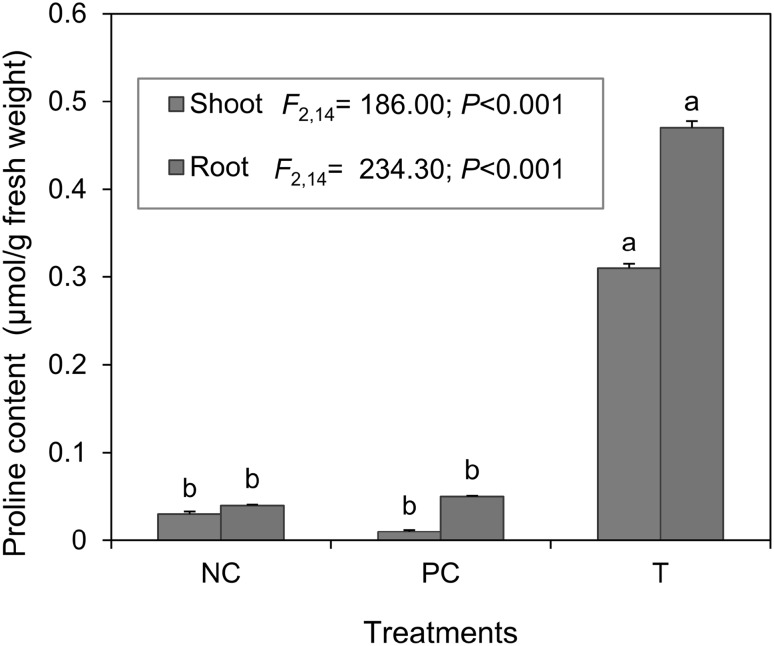
Fig. 2.
Proline content of root and shoot tissues of tomato plants inoculated with Nectria haematococca. Error bars indicate ± standard errors. Bars bearing same letter for a fungal structure are not significantly (P > 0.05) different according to Duncan’s Multiple Range test. NC, PC and NH, represent negative control, positive control and N. haematococca inoculated, respectively

