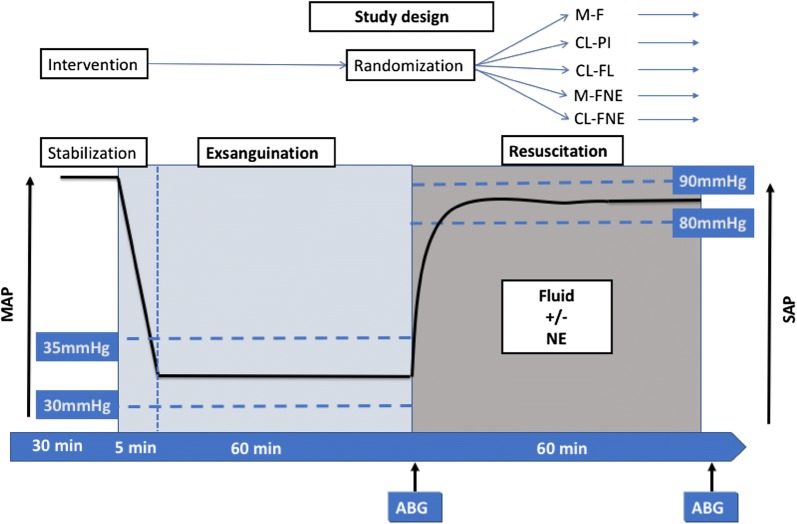
Fig. 1.
Experimental protocol. The continuous line represents the evolution of MAP during the two phases of the study (acute exsanguination followed exsanguination or transfusion to maintain MAP between 30 and 35 mmHg). Time is represented on the horizontal arrow. Each phase lasted 60 min. ABG arterial blood gas, M-F manual fluid group, CL-PI closed-loop PI group, CL-FL closed-loop FL group, M-FNE manual fluid and norepinephrine group, CL-FNE closed-loop fluid and norepinephrine group

