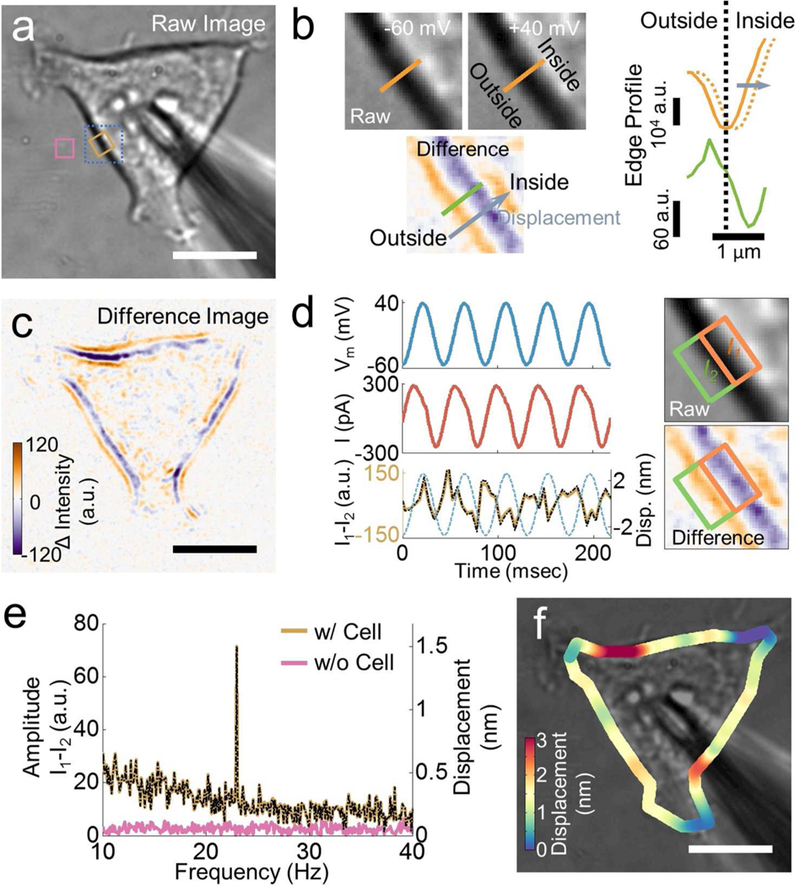
Figure 2: Relationship between membrane potential and cellular membrane displacement.

a) Bright field image of a HEK293T cell and a micropipette used to change the membrane potential. Left panel: Zooming-in of the bright field images (grey scale) of the cell edge at −60 and 40 mV, and difference image (colored) obtained by subtracting the bright field image obtained at −60 mV from that at 40 mV. The characteristic orange and purple lines represent the cell edge displacement. Right panel: Corresponding intensity profiles along lines indicated in the images, where the solid and dashed orange lines are from the bright field images at −60 mV and 40 mV, and the solid green line is from the difference image. c) Difference image of the entire cell showing cell edge displacement and local variability (intensities for the orange and purple bands) of the displacement. d) Left panel: Time traces of applied potential at frequency 23 Hz (blue), measured current (red) from the patch clamp setup, and differential intensity (I1 -I2, brown) from the optical imaging method. Note that the actual displacement determined from the differential detection algorithm is shown as a black line overlaid on top of the differential intensity, and the potential is indicated as dashed blue line. Right panel: A region of cell edge shown in raw bright field (grey scale) and difference (colored) images. e) Fast Fourier Transformation (FFT) power spectra of differential intensity in regions with (brown) and without (pink) cell (as indicated as colored squares in a). The FFT power spectrum of the membrane displacement is shown as a black dashed line. f) Membrane displacement map obtained from the differential detection algorithm. Scale bar in a, c, f): 10 μm.
