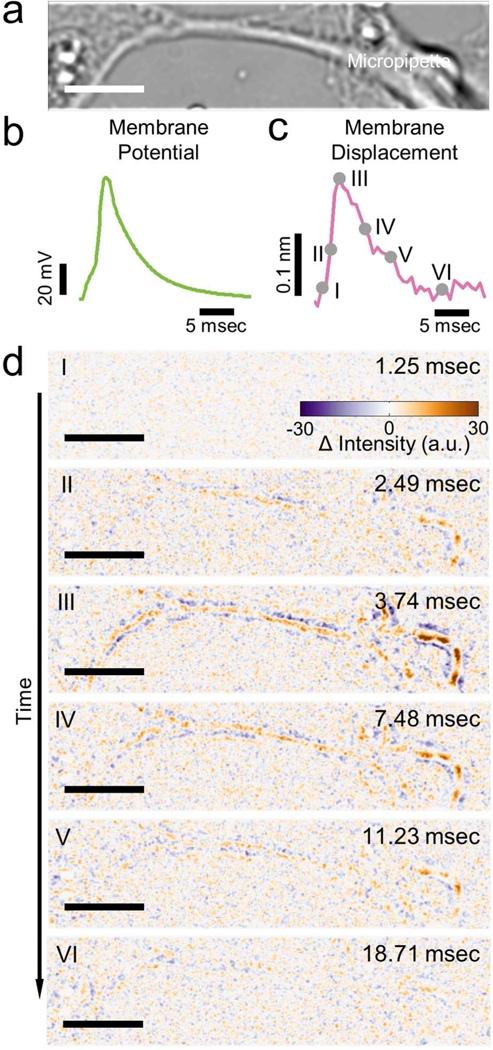
Figure 3: Mechanical displacement accompanying action potential in single mammalian neurons.

a) Bright field image of a hippocampal neuron. b) Action potential of the neuron (green). c) Simultaneously recorded membrane displacement of the same neuron (magenta) with 440 traces averaged. d) Snapshots of difference images of the hippocampal neuron at different stages of the action potential spike. Filled grey circles in c) indicate the moments where the difference images were recorded. Scale bar: 10 μm.
