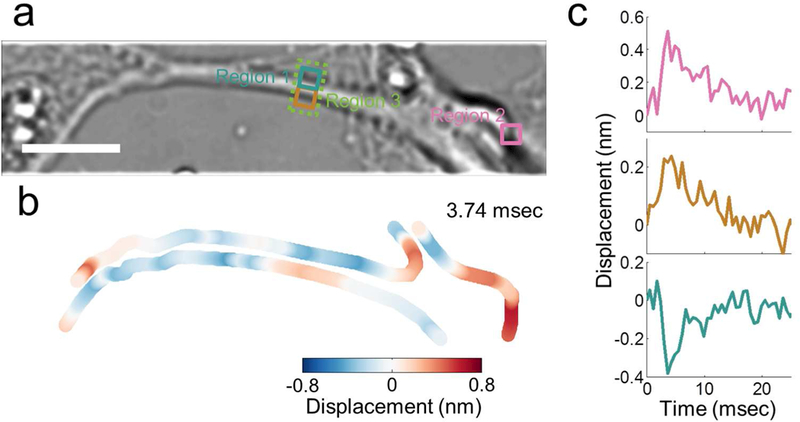
Figure 4: Mapping and quantification of local membrane displacement accompanying an action potential.

a) Bright field image of a hippocampal neuron. b) Local membrane displacement map at the peak of the action potential, where red indicates outward displacement, blue indicates inward displacement. c) Mechanical waveforms at locations indicated by the corresponding colored squares in a). Scale bar: 10 μm
