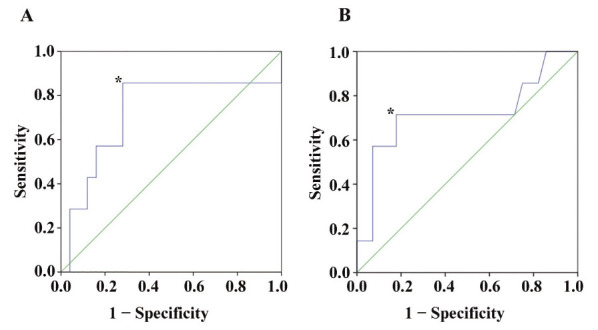
Fig. 1.

Receiver-operating characteristic (ROC) curves. (A): The area under the ROC curve for NLR was 0.726, and a level of 2.9 was determined as the cutoff value* (sensitivity = 0.857, and specificity = 0.720). (B): The area under the ROC curve for LMR was 0.719, and a level of 2.4 was determined as the cutoff value from the nearest coordinate point* (sensitivity = 0.714, and 1- specificity = 0.179) to the left upper corner.
