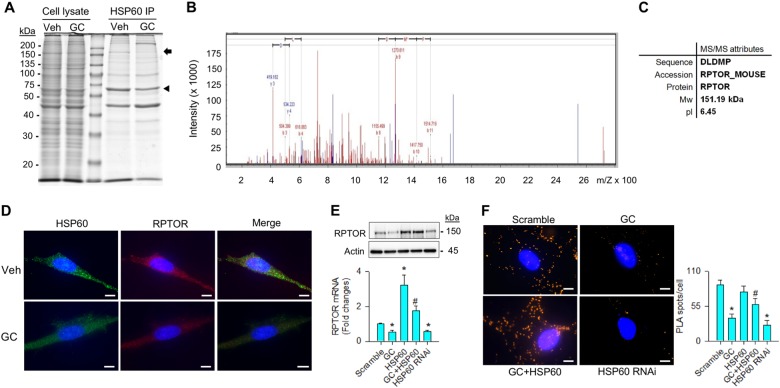
Fig. 2. Analyses of HSP60 modulation of RPTOR signaling in osteoblasts.
a A protein corresponding to 150 kDa (arrow) along with HSP60 (arrowhead) existed in HSP60 immunoprecipitates. Images of cell lysate indicate equal load of specimens for electrophoresis. b Tandem mass spectrum and c attributes of peptide homologous to RPTOR. d Weak HSP60 (green) and RPTOR (red) immunofluorescence in glucocorticoid-stressed osteoblasts. Scale bars, 16 μm. e Increasing HSP60 attenuated the glucocorticoid-induced loss of RPTOR mRNA expression and protein levels. f Images of HSP60 and RPTOR-ligated complexes. Forced HSP60 expression increased HSP60 and RPTOR ligation reaction in osteoblasts, whereas HSP60 knockdown reduced the reaction. Scale bar, 16 μm. Experiments results are expressed as mean ± standard error. Asterisks (*) resemble a significant difference (P < 0.05) vs. scramble group, and hashtag (#) indicates a distinguishable difference (P < 0.05) vs. glucocorticoid-treated group

