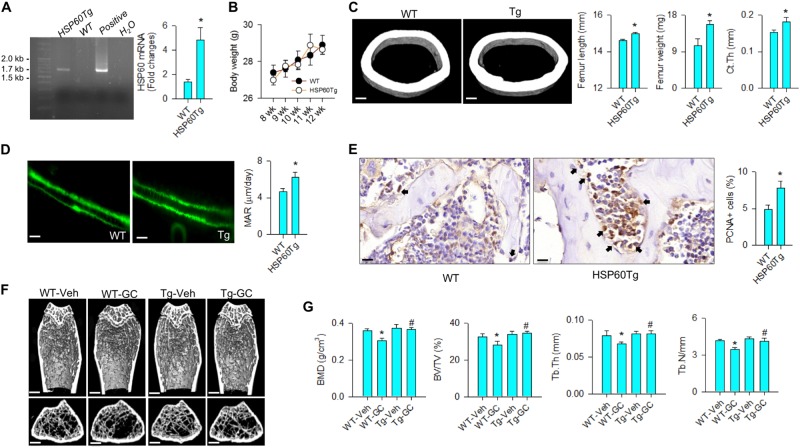
Fig. 6. Analyses of bone mass and microstructure of HSP60Tg mice.
a HSP60Tg mice carried the construct and showed increased HSP60 expression of bone tissue. Images of agarose electrophoresis of positive and H2O indicate positive control (plasmid construct) corresponding to 1.7 kbp and negative control, respectively. b Body weight of HSP60Tg was comparable to wild-type mice. c HSP60Tg mice showed significant increases in femur weight, femur length, cortical bone thickness (scale bar, 50 μm), and d calcein-labeled bone mineral acquisition (scale bar, 30 μm). e Osteoblasts in bone tissue in HSP60Tg mice displayed strong PCNA immunostaining (arrows). Scale bar, 10 μm. f μCT images of tibiae. Glucocorticoid-treated wild-type mice showed sparse trabecular microarchitecture, whereas abundant trabecular bone remained in glucocorticoid-treated HSP60Tg mice. Scale bar, 5 mm. g HSP60Tg mice displayed minor responses to the glucocorticoid-induced loss of BMD, BV/TV, Tb.Th, and Tb.N. Experiments were performed on six mice, and results are expressed as mean ± standard error. Asterisks (*) resemble a significant difference (P < 0.05) vs. wild-type group, and hashtag (#) indicates a distinguishable difference (P < 0.05) between the group of interest vs. glucocorticoid-treated wild-type group

