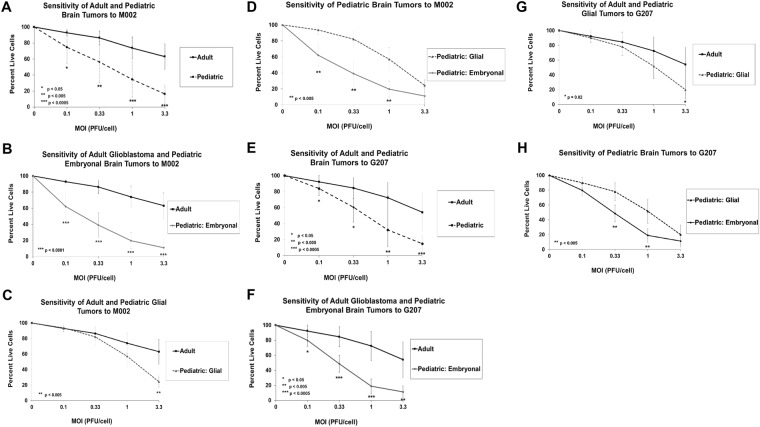
Figure 2.
Average dose-response of pediatric brain tumor (all pediatric tumors, pediatric embryonal tumor subset, pediatric glial tumor subset) and adult glioblastoma ex vivo cells from patient-derived xenografts to HSV M002 and G207 after 72 hours as measured by cytotoxicity assay. Plot at each dose level represents the average ± standard deviation of each tumor group. (A) Comparison of adult glioblastoma tumors and all pediatric brain tumors to M002. (B) Comparison of adult glioblastoma tumors and pediatric embryonal tumors to M002. (C) Comparison of adult glioblastoma tumors and pediatric glial tumors to M002.(D) Comparison of pediatric glial and embryonal tumors to M002. (E) Comparison of adult glioblastoma tumors and all pediatric brain tumors to G207. (F) Comparison of adult glioblastoma tumors and pediatric embryonal tumors to G207. (G) Comparison of adult glioblastoma tumors and pediatric glial tumors to G207. (H) Comparison of pediatric glial and embryonal tumors to G207. MOI, multiplicity of infection.

