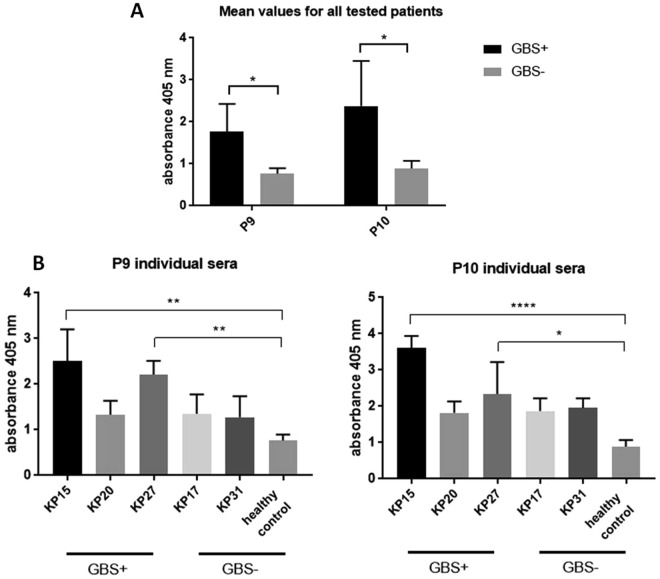
Figure 6.
Reactivity of GBS positive umbilical cord blood sera with C. difficile peptides P9 and P10. (A) shows mean value obtained for sera GBS+ and GBS− for both peptides. (B) shows data for individual patients GBS+ and GBS− (healthy controls and women with other diseases) obtained for peptide P9. (C) shows data for individual patients GBS+ and GBS− (healthy controls and women with other diseases) obtained for peptide P10. All figures show data from at least three independent measurements, means with SD, data analyzed with 2way ANOVA *P < 0.05; **P < 0.01; ***P < 0.001; ****P < 0.0001.

