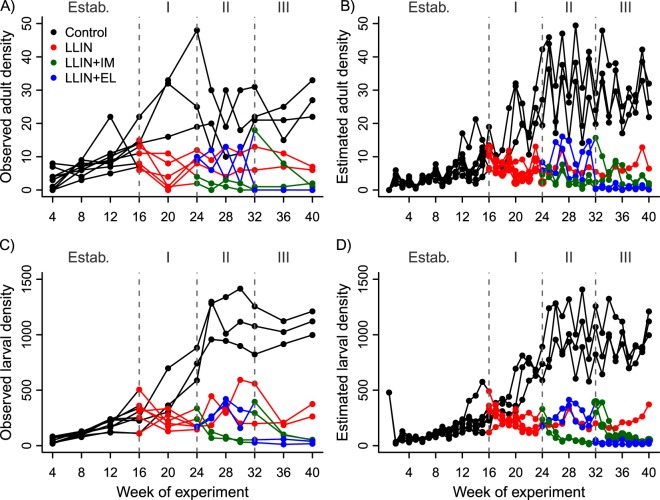
Figure 4.
Observed (left column) and estimated (right column) mean abundance of adult female (top row) and larval An. arabiensis (bottom row) mesocom populations during the experiment. Black lines correspond to control populations (not exposed to any intervention), red lines to populations exposed to long lasting insecticidal nets (LLINs), green lines to populations exposed to LLINs and Ivermectin (IM), and blue lines to populations exposed to LLINs and eaves louvers (EL). See Table S2 for summary of estimated mean densities and associated 95% credible intervals.

