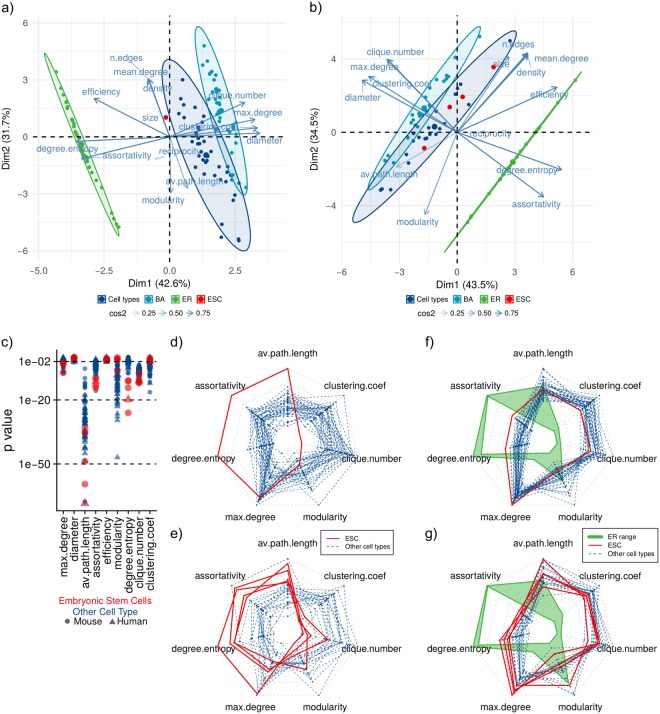
Figure 5.
Comparison of network features with random model analogs. (a) Human and (b) mouse network features PCA including real, ER, and BA networks. (c) Network features p values comparing real features with BA model analogs. (d) Human and (e) mouse radar plots of network features z-score compared to BA model analogs. (f) Human and (g) mouse features measures, green polygons show ER networks’ range for each feature. ESC values are shown in red solid lines, and the other cell types are shown in blue dashed lines.

