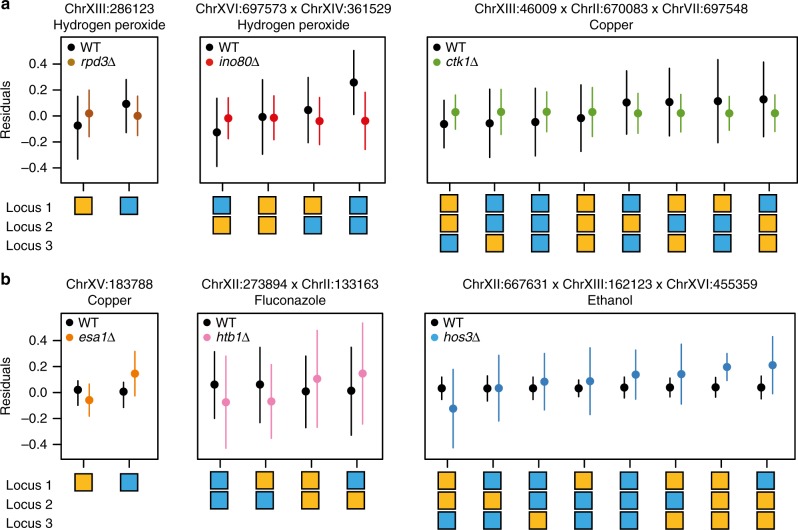
Fig. 1.
Examples of mutation-responsive genetic effects. a shows representative examples of one-, two-, and three-locus mutation-responsive effects with larger phenotypic effects in wild-type segregants than mutants. In contrast, b shows representative examples of one-, two-, and three-locus mutation-responsive effects with larger phenotypic effects in mutants than wild-type segregants. Means depicted along the y axis show residuals from a fixed-effects linear model that includes the mutation-independent effect of each involved locus, as well as any possible lower-order mutation-independent and mutation-responsive effects. The different genotype classes are plotted below the x axis. Blue and orange boxes correspond to the BY and 3S alleles of a locus, respectively. Error bars represent one standard deviation from the mean

