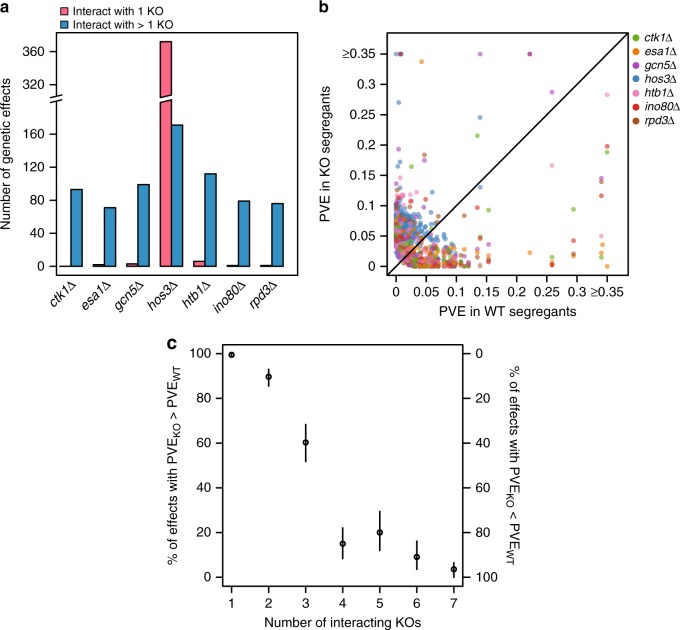
Fig. 5.
Analysis of mutation-responsive effects across knockout backgrounds. In a, the number of mutation-responsive effects that interacted with only one knockout (pink) or interacted with multiple knockouts (blue) are shown for each knockout. In b, the phenotypic variance explained (PVE) for each mutation-responsive effect is shown in the relevant knockout (KO) segregants, as well as in the wild-type (WT) segregants. The PVE for each mutation-responsive effect was determined using fixed-effects linear models fit within each individual background (Methods). Mutation-responsive effects are color-coded by the knockout population in which they were identified. In c, the percentage of mutation-responsive effects that showed larger phenotypic effects in mutants than in wild-type segregants (y axis, left side) and mutation-responsive effects that showed larger phenotypic effects in wild-type segregants than in mutants (y axis, right side) is depicted. These values are plotted as a function of the number of knockouts that interact with a given mutation-responsive effect. Error bars represent 95% bootstrap confidence intervals (Methods)

