
Figure 9.
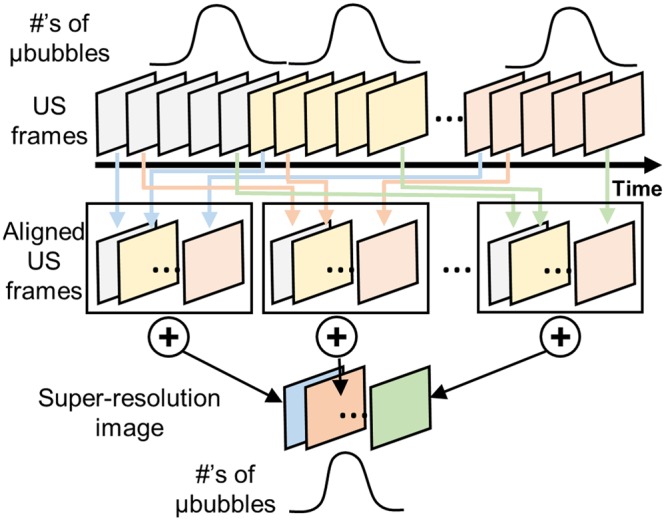
Graphical diagram of STIC data acquisition. Sequentially acquired multiple datasets are synchronized to form a single cardiac cycle event based on the cardiac pulsation estimated by the numbers of bubbles.
Official websites use .gov
A
.gov website belongs to an official
government organization in the United States.
Secure .gov websites use HTTPS
A lock (
) or https:// means you've safely
connected to the .gov website. Share sensitive
information only on official, secure websites.
Graphical diagram of STIC data acquisition. Sequentially acquired multiple datasets are synchronized to form a single cardiac cycle event based on the cardiac pulsation estimated by the numbers of bubbles.