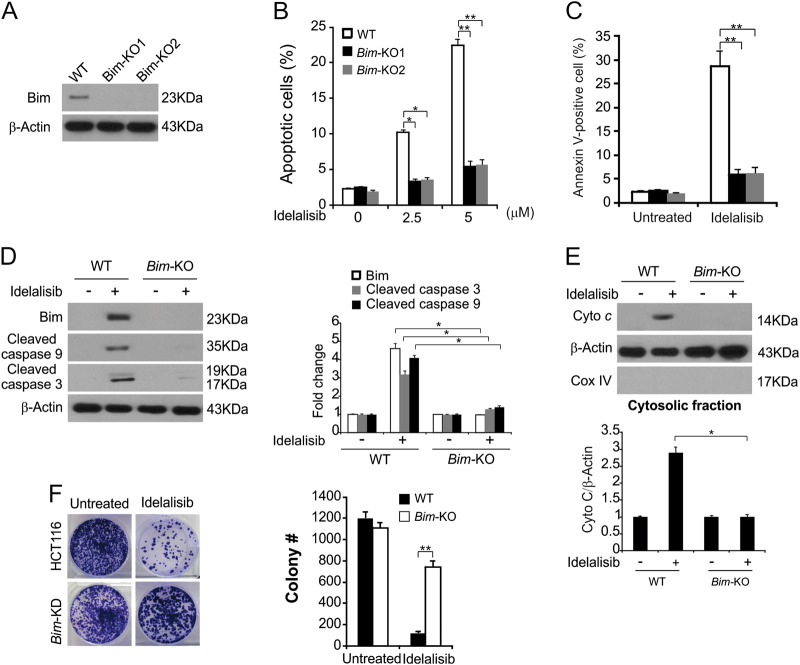
Fig. 4. Bim mediates the antitumor effects of idelalisib through the mitochondrial pathway.
a The Bim expression in Bim-KO cells were analyzed by western blotting. b WT and Bim-KO HepG2 cells were treated with idelalisib at indicated concentration for 24 h. Apoptosis was analyzed by a nuclear fragmentation assay. The results were expressed as the means ± SD of three independent experiments. **P < 0.01; *P < 0.05 (one-way ANOVA with Tukey’s post hoc test). c WT and Bim-KO HepG2 cells were treated with 5 μmol/L idelalisib for 24 h. Apoptosis was analyzed by annexin V/PI staining followed by flow cytometry. The results were expressed as the means ± SD of three independent experiments. **P < 0.01 (one-way ANOVA with Tukey’s post hoc test). d WT and Bim-KO HepG2 cells were treated with 5 μmol/L idelalisib for 24 h. Cleaved caspase 3 and 9 expression was analyzed by western blotting and normalized to β-actin. Data represent the mean ± SD of three independent experiments. *P < 0.05 (Student’s t-test). (e) The cytoplasm and mitochondria were fractionated from WT and Bim-KO HepG2 treated with 5 μmol/L idelalisib for 24 h. The distribution of cytochrome c was analyzed by western blotting and normalized to β-actin. Data represent the mean ± SD of three independent experiments. *P < 0.05 (Student’s t test). β-actin and cytochrome oxidase subunit IV (Cox IV) were analyzed as the control for loading and fractionation. f WT and Bim-KO HepG2 cells were treated with 5 μmol/L idelalisib for 24 h. Colony formation assay was done by seeding an equal number of treated cells in 12-well plates, and then staining attached cells with crystal violet 14 days later. Left, representative pictures of colonies; Right, quantification of colony numbers. The results were expressed as the means ± SD of three independent experiments. **P < 0.01 (Student’s t-test)

