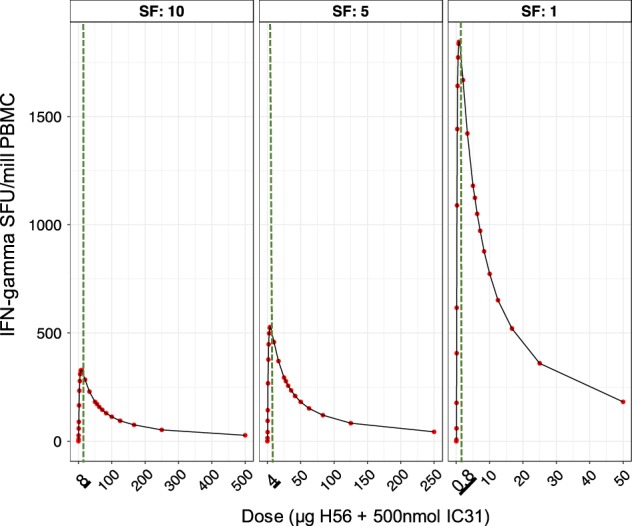
Fig. 3.

Human predicted H56 + IC31 dose vs. IFN-γ response curve at a late time point (day 224) based on the mouse dose ranging data. Red points are the predicted median number of total IFN-γ secreting CD4+ T cells by the IS/ID model for a range of doses. The green vertical dashed line is the most immunogenic dose in the dose–response curve, the value of which is underlined in the x-axis. Each panel shows the results for dose allometric scaling factors of 10, 5 and 1 (for the whole range of scaling factors 1–10, see Figure S10)
