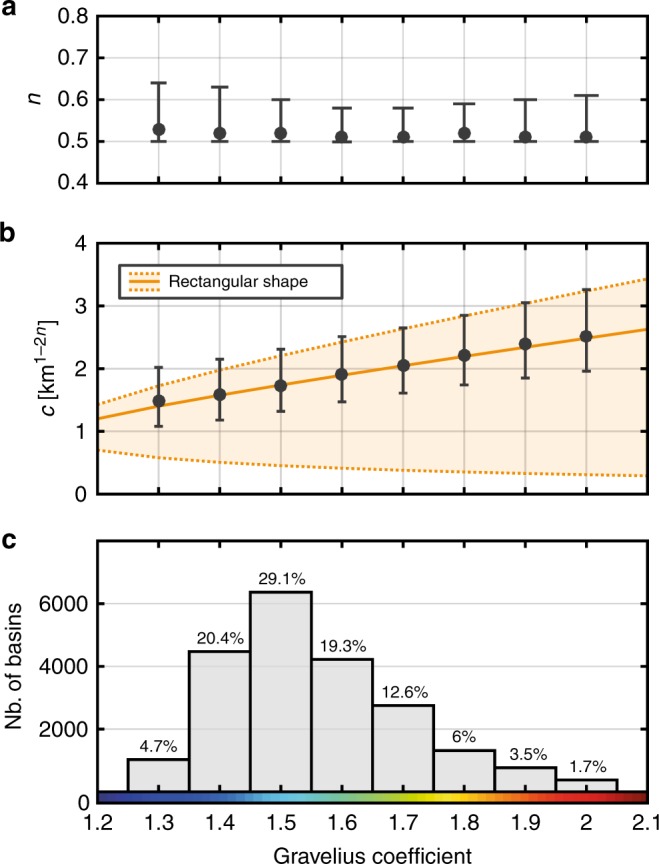
Fig. 5.

Hack’s Law parameters vs. Gravelius compacity coefficient. a, b Exponent (n) and coefficient (c) for the eight interval classes of GC showed in Fig. 2. Error bars are defined considering the 95% likelihood contour obtained for each class. Orange solid line corresponds to the relation obtained from Eq. (4). Orange dotted lines represent the lower and upper bounds for the Hack’s coefficient assuming a simple rectangular basin. c Number of basins for each class of GC and its associated proportion within the dataset
