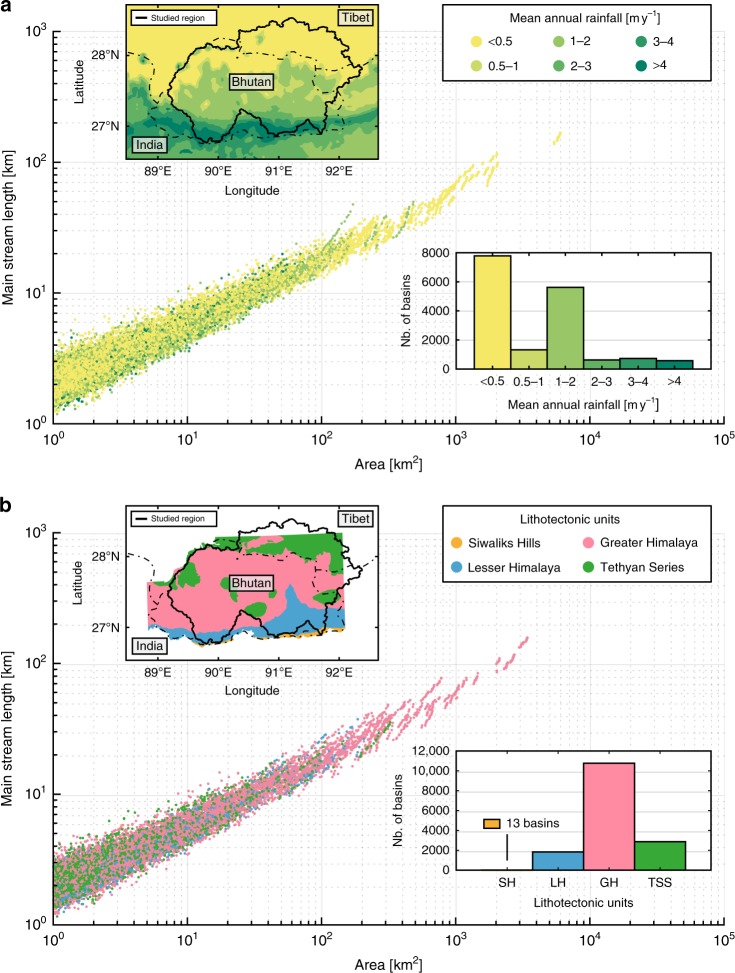
Fig. 6.
Length–area relationship to mean annual rainfall and lithology. a Scatter plot of the main stream length with respect to the basin size. Colour scale indicates the annual rate of precipitation for each basin. Inserts are a map of the six main annual rainfall classes16 and a histogram showing the distribution of basins with respect to these classes. b Scatter plot of the main stream length with respect to the basin size. Colour gives the geological domain for each basin. Inserts are a map of the four major litho-tectonic units in Bhutan17 and a histogram showing the distribution of basins with respect to these units

