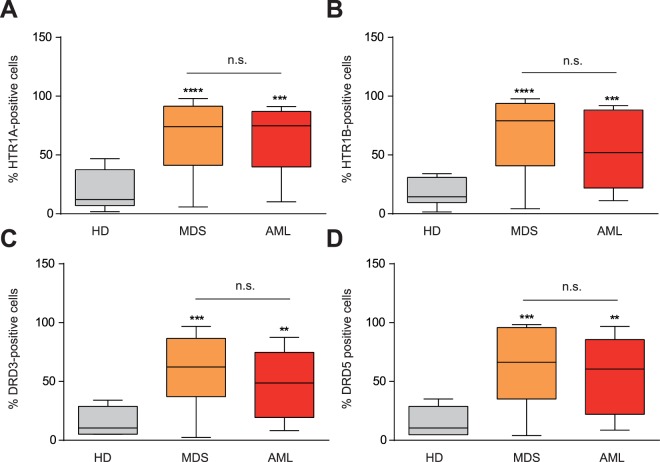
Figure 1.
HTR1A/B and DRD3/5 are expressed in AML and MDS. (A) HTR1A (HD n = 6; MDS n = 54; AML n = 14), (B) HTR1B (HD n = 6; MDS n = 55; AML n = 14), (C) DRD3 (HD n = 4; MDS n = 47; AML n = 14), and (D) DRD5 (HD n = 4; MDS n = 47; AML n = 14) surface expression measured by flow cytometry in blood samples from healthy donors (HD), MDS samples and AML samples. Frequency of positive cells for each marker is graphed as a box-and-whisker (turkey) plot, the statistical median is indicated as a horizontal line, error bars correspond to SEM and boxes indicated the lowest and upper quartile. **p < 0.01; ***p < 0.001; ****p < 0.0001.

