Figure 5.
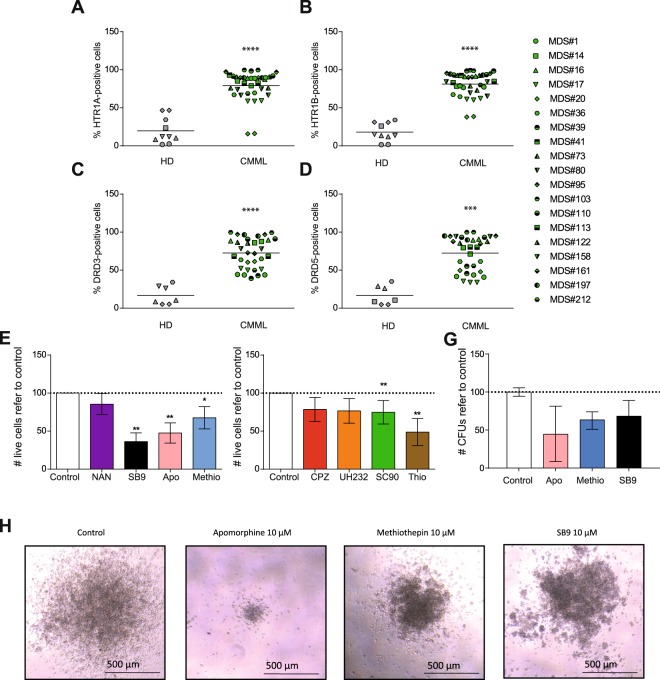
DRs and HTR1s are differentially express on CMML samples. CMML patient samples and healthy blood cells (HD) were tested for (A) HTR1A, (B) HTR1B, (C) DRD3 and (D) DRD5 surface expression by flow cytometry. Frequency of positive cells is represented. Each symbol type corresponds to a CMML patient samples, each symbol corresponds to an experimental point. Grand mean values are shown as a horizontal line. CMML patient samples were treated for 72 h with 10 µM of (E) subtype specific-HTR antagonists (apomorphine –apo–, HTR1/2; methiothepin –methio–, HTR1/2; NAN190 –NAN–, HTR1A; SB-224289 –SB9–, HTR1B) and 10 μM of (F) subtype specific-DR antagonists (SCH-23390 –SC90-, DRD1/5; UH-232 –H232-, DRD2/3; Chlorpromazine –CPZ-, pan-DR; Thioridazine –Thio-, pan-DR) and cell viability was measured by 7-AAD exclusion by flow cytometry. Data is normalized against vehicle-treated control sample. CMML n = 4 in triplicates. (G) CMML patient sample were plated in methylcellulose and the number of CFUs refer to control is represented. Normalized data refer to control are represented as mean ± range. CMML n = 2 in duplicates. *p < 0.05; **p < 0.01; ***p < 0.001; ****p < 0.0001.

