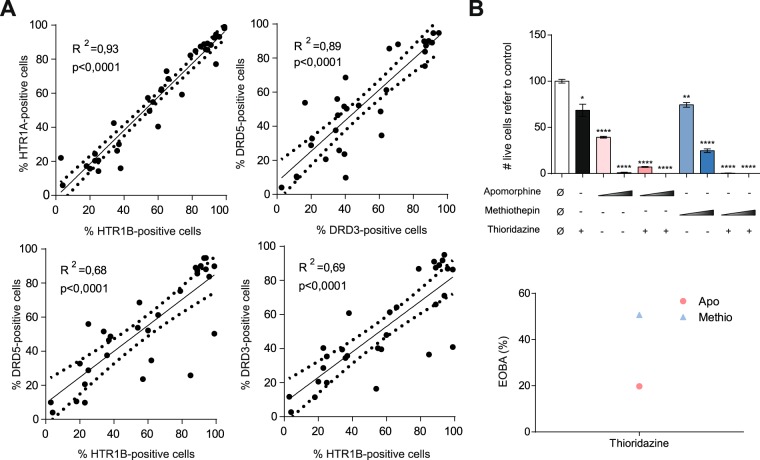
Figure 6.
DR3/5 and HTR1A/B are co-expressed in MDS and CMML cells. (A) Frequency of HTR1A- vs. HTR1B- (upper left), DRD3 vs. DRD5 (upper right), HTR1A vs. DRD5 (lower left) and HTR1B vs. DRD5 (lower right)-positive cells are represented. The coefficient of determination measured as R2 is specified. The regression line is shown as a solid line; the confidence interval is represented as a dotted line. (B) HL-60 AML cell line was treated for 72 h with apomorphine (5 µM and 10 µM) and methiothepin (5 µM and 10 µM), in combination with thioridazine at 10 µM. Cell viability was measured by 7-AAD exclusion by flow cytometry (left panel). The synergistic effect in combination treatment measured was evaluated based on EOBA (Excess Over Bliss Additivism) (right panel). *p < 0.05; **p < 0.01; ***p < 0.001; ****p < 0.0001.

