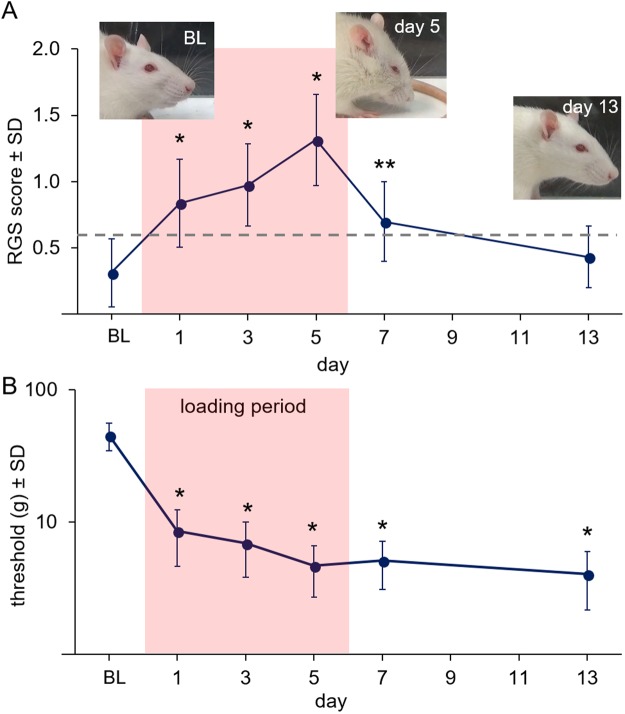
Figure 3.
(A) RGS scores increase from baseline (BL) after 3.5N loading on days 1, 3, and 5 (*p < 0.001) and 1 day after the cessation of loading (day 7) (**p = 0.019). However, RGS scores return to baseline levels by day 13 (p = 0.820). The grey line indicates the previously reported analgesic intervention score for the RGS46. (B) Head withdrawal thresholds (g) decrease from BL levels both during and after loading on all days (*p < 0.01). The loading period is labeled in (B) and shown in the pink shaded region of both panels.

