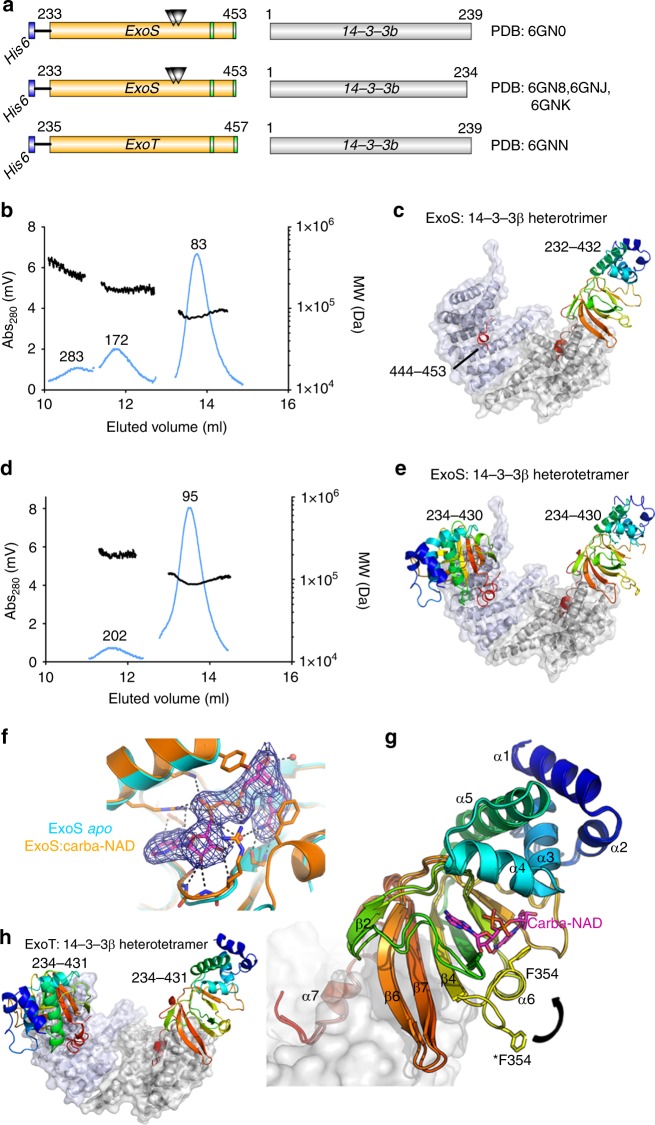
Fig. 1.
Crystal structures of 14-3-3β:ExoS and 14-3-3β:ExoT complexes. a Schematic representation of co-expression constructs used for structure determination. Triangles represent the E379A,E381A double mutation. b, d SEC-RALS profiles of the heterotrimeric (b) and heterotetrameric (d) 14-3-3β:ExoS complexes (main peaks). Estimated molecular weights are indicated. c, e Structures of the 14-3-3β:ExoS heterotrimer (c) and heterotetramer (e). The 14-3-3β dimer is shown in gray. Numbers in italics indicate the ExoS residues that were resolved in the electron density. f Detail of the electron density around carba-NAD in the active site of ExoS (2Fobs – Fcalc electron density map contoured at 1σ (0.1073 eÅ−3)). g Comparison of the ExoS apo and carba-NAD structures. The loop containing F354 is in two different conformations, where the open conformation from the apo structure is marked with an asterisk. Secondary structural elements are numbered. h Structure of the 14-3-3β:ExoT heterotetramer. c, e, g, h ExoS respectively ExoT are shown colored in a gradient from the N-terminus (blue) to the C-terminus (red) of the construct

