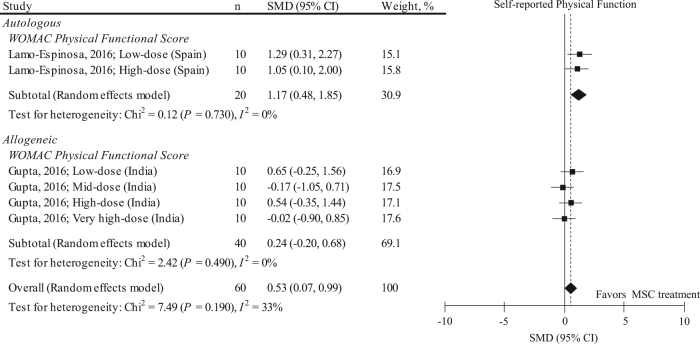
Fig. 4.
Results of sensitivity analysis representing SMD and 95% CI for the self-reported physical function (WOMAC physical functional score) between pre and post MSC treatment at final follow-up in 2 RCTs with 6 data sets (n = 60). The diamond represents the pooled SMD using the DerSimonian-Laird method. The vertical line at 0 represents no difference. Including only RCTs attenuates the effects of MSC in improving WOMAC functional score (pooled SMD: 0.53, 95% CI: 0.07, 0.99; P = 0.020) compared to those shown in Fig. 3

