FIGURE 1.

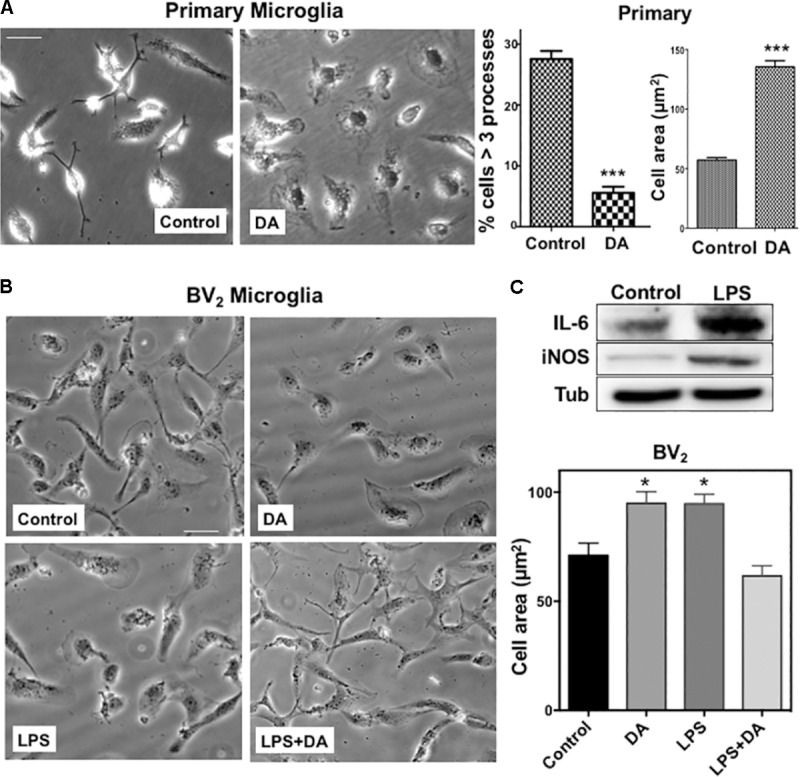
(A) Changes in the morphology of primary microglia upon DA treatment. Primary microglia cells showed small cell body and multiple processes. Upon DA (2 μM) treatment for 30 min, they acquired flattened morphology and area of cells were increased significantly, accompanied by a decreased number of cells having multiple processes (unpaired t-test: ∗∗∗P < 0.005). Values are means ± standard error of 15–20 cells. Right panels show the measurements of cellular process number and cell area. (B) BV2 microglia were stimulated with LPS and DA, and their morphology (left panels) and cell area (right panel) are shown (ANOVA: ∗P < 0.05 compared to vehicle control ##P < 0.05 compared to LPS). Scale bar = 20 μm. (C) Increased expression of IL-6 and iNOS upon LPS stimulation in BV2 cells.
