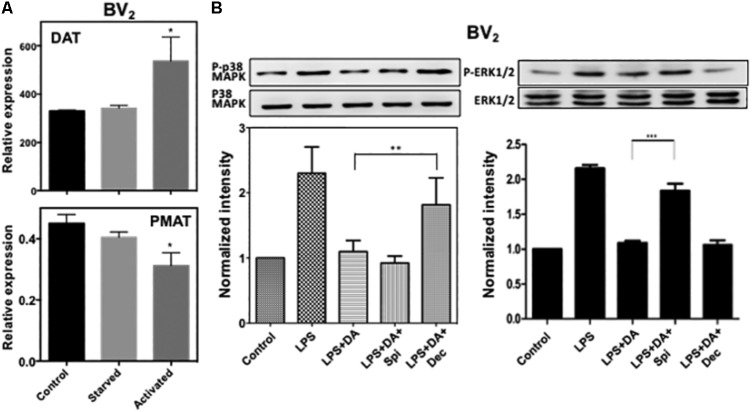
FIGURE 6.
(A) Expression of DAT and PMAT in resting and activated microglia. Quantitative RT-PCR detected mRNA for DAT and PMAT in resting and activated BV2 microglia. The expression level of DAT increased significantly in activated microglia while PMAT expression decreased. (ANOVA: ∗P < 0.05 compared to control). (B) Activation of p38MAPK resulted from the activation of microglia by LPS can be blocked by decynium while activation of ERK1/2 can be blocked by spiperone (ANOVA: ∗∗P < 0.01, ∗∗∗P < 0.005).

