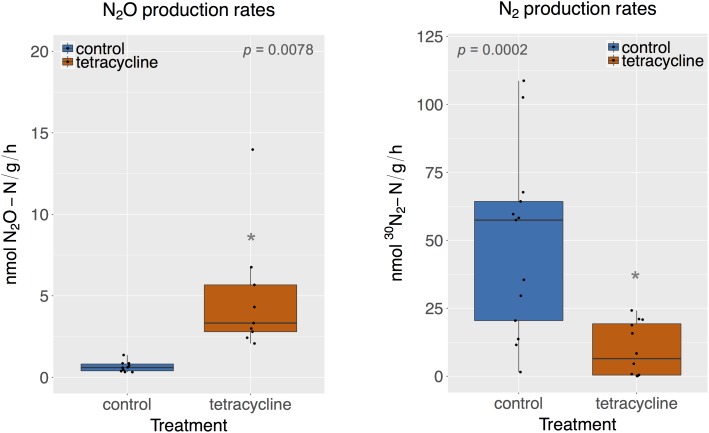
FIGURE 1.
N2O and N2 production rates of control (blue) and tetracycline (red) samples. Significant difference between control and tetracycline treatment is marked with ∗ (paired Mann–Whitney-Wilcoxon test, p < 0.05). Each sample is represented by one point. The boxes represent the first and third quartiles, with median value bisecting each box. The whiskers extend to the largest/smallest value, excluding outliers (data beyond 1.5×inter-quartile range).

