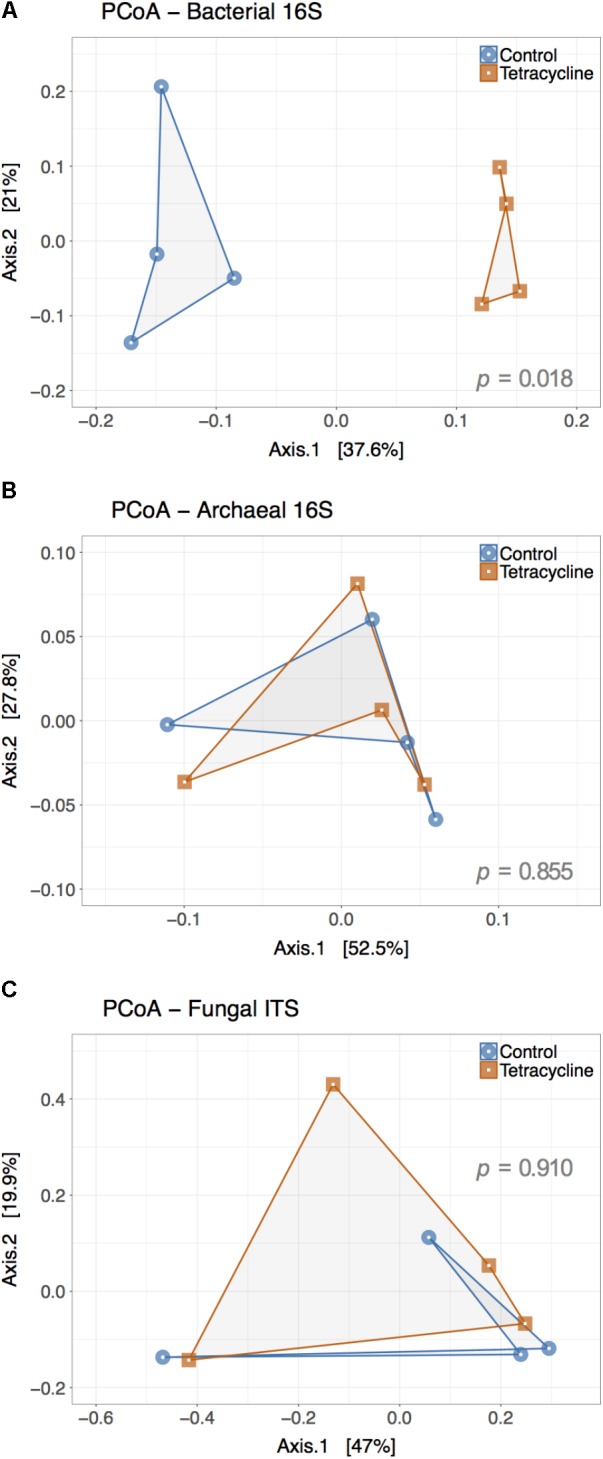
FIGURE 5.

Principal Coordinate Analysis (PCoA) plot representing the β-diversity of the bacterial (A), archaeal (B), and fungal (C) communities from control (blue) and tetracycline (red) samples. Both bacterial and archaeal communities were examined based on 16S rRNA gene sequences while ITS sequences were used for fungal communities. Sample dissimilarity and distance analysis was calculated using the Bray–Curtis dissimilarity index. Significant effects (p < 0.05) of the treatment in OTU dissimilarity were tested by multivariate permutational ANOVA (PERMANOVA) and the p-values are shown in each plot.
