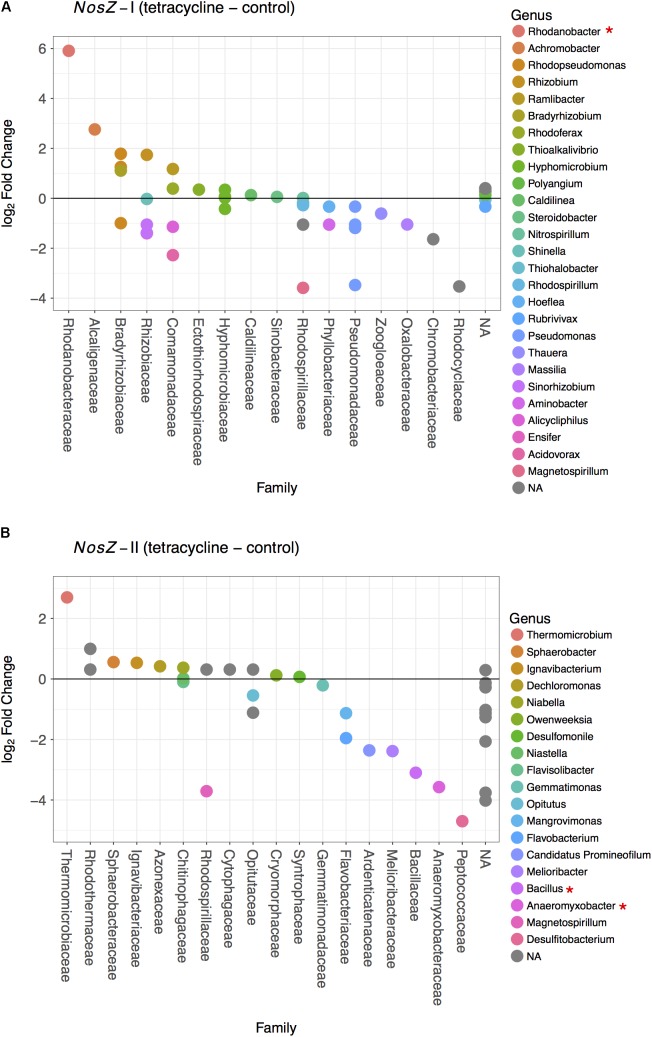
FIGURE 6.
Difference in the nosZ-carrying microbial community composition between tetracycline and control samples for nosZ-I (A) and nosZ-II (B) bacteria. Each dot denotes a taxon that is either higher (log2 fold change > 0) or lower (log2 fold change < 0) in the tetracycline treated samples when compared to the control samples. Taxa are organized by family in decreasing order and colored by genus. Normalized abundances were obtained by metabolic inference of 16S rRNA gene sequences using PAPRICA and tested for significant effects (p < 0.05) of treatment by fitting the data into a generalized linear model (GLM) based on the negative binomial distribution. Taxa with significant difference between tetracycline and control samples are marked with ∗ in the legend.

