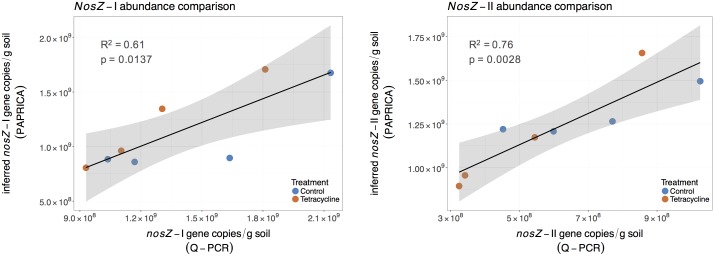
FIGURE 8.
Linear regressions comparing inferred and quantified nosZ gene abundances for control (blue) and tetracycline (red) samples. The inferred nosZ abundances were calculated by multiplying the relative abundances obtained through metabolic inference (PAPRICA) with the 16S rRNA gene abundances. The shaded area represents the 95% confidence interval of the linear regression predictions.

