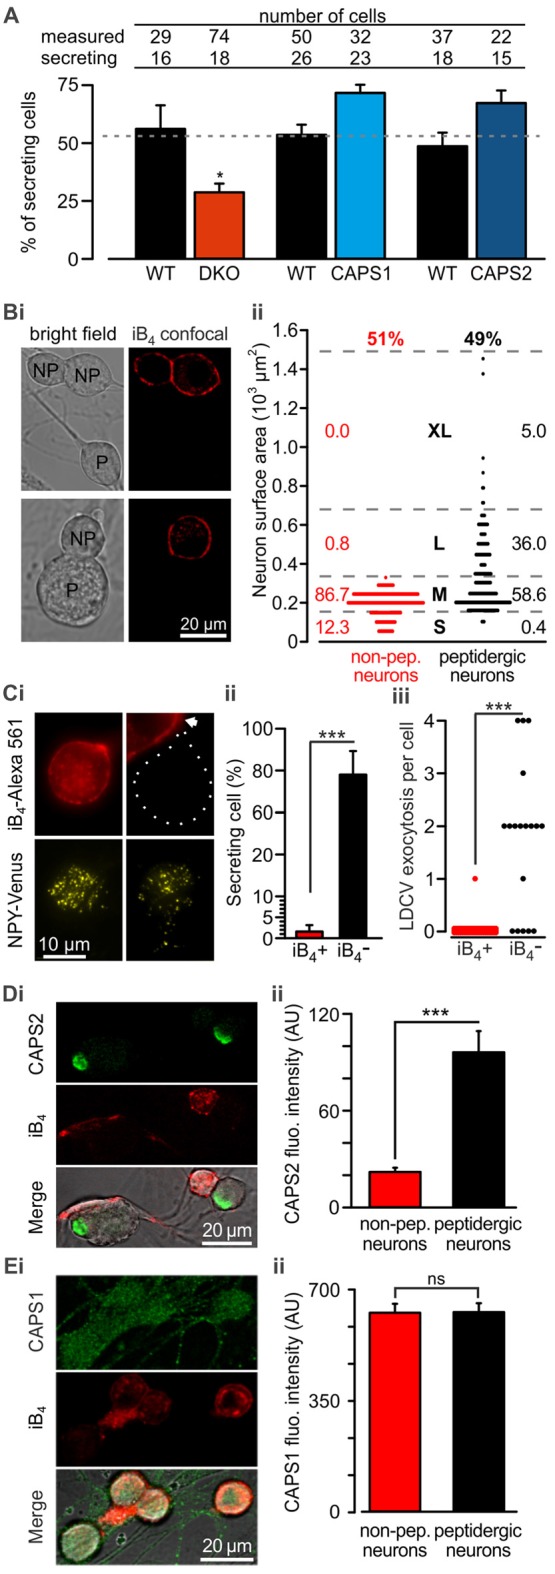
Figure 3.

CAPS2 is localized to the secreting peptidergic neurons. (A) Percentage of cells that released LDCVs upon field electrode stimulation in CAPS DKO, CAPS1-, or CAPS2-overexpressing neurons compared to their WT controls. The cells that responded to the stimulus with LDCV exocytosis are presented in Figure 2. The gray dotted line corresponds to the average proportion of all responding WT controls. (NWT & DKO = 5 and 6 respectively, NCAPS1 & WT control = 5, NCAPS2 & WT control = 7; *p < 0.05 Student t-test). (Bi) Two exemplary confocal images of live DRG neurons stained with isolectin B4 (iB4)-Alexa 561. IB4 binds to the plasma membrane of non-peptidergic DRG neurons but due to constitutive endocytosis some cytoplasmic staining is also visible. Stained neurons are labeled with the letters “NP” on joint bright field images. Peptidergic neurons are void of iB4-Alexa 561 staining and are indicated with “P” on the bright field images. (Bii) Scatter dot plot of peptidergic and non-peptidergic DRG neuron size. Neurons were classified as small (S), medium (M), large (L), and extra-large (XL). The thresholds between sizes (gray stippled lines) were set using a distribution histogram. Percentages of neurons in each size category are indicated at the side of the dot plot. Proportions of peptidergic and non-peptidergic DRG neurons in randomly acquired images are indicated on top (Nmice = 2, nneurons = 226 and 210 non-peptidergic and peptidergic neurons, respectively). (Ci) LDCV secretion was measured in DRG neurons stained with iB4-Alexa 561 (top, epifluorescence images). Left and right panels present non-peptidergic and peptidergic (dotted line) DRG neurons, respectively, transfected with NPY-Venus (bottom, TIRFM images). Localization of NPY-Venus in LDCVs in peptidergic and non-peptidergic neurons was verified (Supplementary Figure S3). Arrow indicates adjacent stained non-peptidergic neuron. (Cii) Percentage of peptidergic and non-peptidergic neurons that released LDCV upon electrical stimulation. The stimulation protocol was identical to that shown in Figure 2. (Ciii) Scatter dot plots of total LDCV secretion from all peptidergic and non-peptidergic neurons. (Nmice = 4, nneurons = 34 and 17 for non-peptidergic and peptidergic neurons, respectively). (Di) Representative confocal images of WT DRG neurons immuno-labeled with anti-CAPS2 antibody (top) and co-stained with iB4-Alexa 561 (middle). The bottom panel presents the overlay with the bright field image. (Dii) The CAPS2 fluorescent intensity in peptidergic and non-peptidergic neurons revealed that CAPS2 was localized to peptidergic neurons (Nmice = 2, nneurons = 57. (Ei) Representative confocal images of WT DRG neurons labeled with anti-CAPS1 antibody (top), and iB4 (middle) and their overlay with the bright field image (bottom). (Eii) Quantification of CAPS1 fluorescence intensity in peptidergic and non-peptidergic neurons shows that CAPS1 is not preferentially localized to a DRG neuron subtype. N = 2 P0 pups, nneurons = 92. T-test was applied in (A) and (Cii), and the Mann-Whitney test was applied in (Ciii), (Dii) and (Eii), ns (not significant) p > 0.05, ***p < 0.001.
