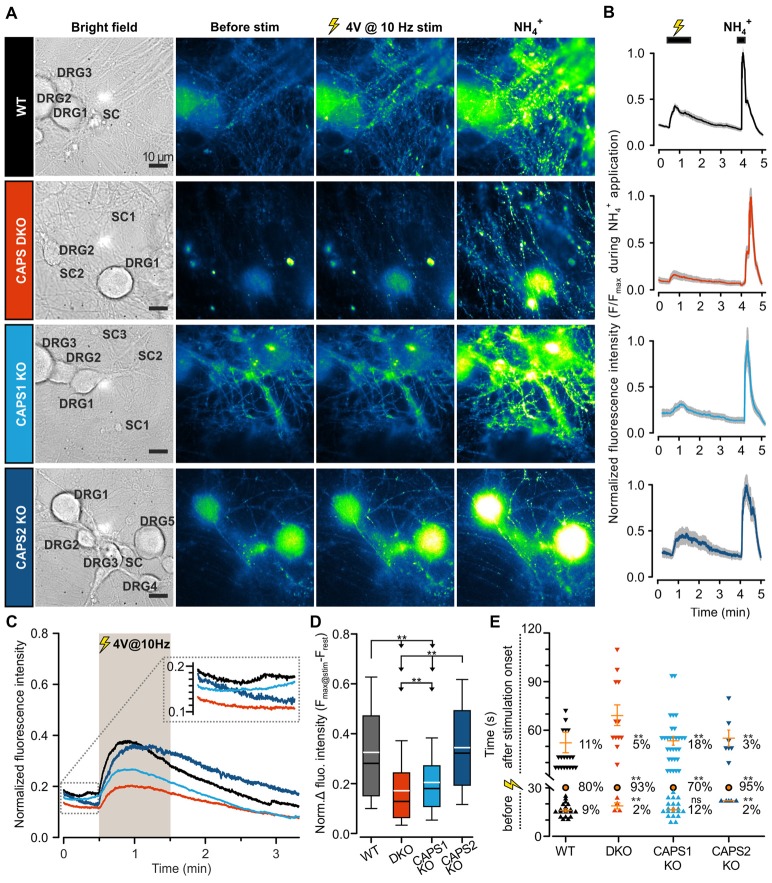
Figure 6.
CAPS1 mediates synaptic transmission between DRG and SC neurons. Embryonic WT, CAPS DKO, CAPS1 KO or CAPS2 KO DRG neurons were transfected with Synaptophysin-pHluorin (SypHy) and co-cultured with WT SC neurons. Synaptic transmission was measured after 8 DIV. (A) Co-cultured neurons are shown from left to right in bright field and in epifluorescence to visualize the SypHy signal before and during 10 Hz field electrode stimulation, and upon NH4Cl application. For the purpose of normalization, 40 mM NH4Cl was used to deprotonate the lumina of synaptic vesicles (SVs), thereby allowing visualization of the entire SV pool. The neuron types are indicated in bright field images. Scale bar = 10 μm. (B) Time course of normalized average SypHy fluorescence intensity at synapses of the recordings displayed on the same row in (A). The fluorescence intensity of each synapse was normalized to their individual maximal intensity measured during NH4Cl application. The SEM range is indicated by the shaded gray area. (C) The normalized average SypHy signal at synapses in response to electrical stimulation for WT neurons (black), CAPS DKO neurons (red), CAPS1 KO neurons (light blue) and CAPS2 KO neurons (navy blue) indicate that deletion of CAPS1 alone was sufficient to severely reduce synaptic transmission. The shaded gray area corresponds to the stimulation period. The SEMs were too small to be displayed. The inset corresponds to the fluorescence intensity fluctuation prior to stimulation. (D) Box plot of the maximum normalized fluorescence intensity increase in SypHy elicited by 10 Hz electrical stimulation. CAPS DKO as well as CAPS1 KO strongly reduced SV exocytosis while CAPS2 deletion had no effect. The white and black lines in the box correspond to the average and median fluorescence increase, respectively. Outliers are not displayed, in order to ease legibility. Significance was tested with ANOVA on rank and Dunn’s post significance test. (E) Quantification of the time point of synaptic response suggests that the presence of CAPS2 causes non-synchronized synaptic activity. The time of synaptic activity was divided into three groups. Each synapse responding either before stimulation or with a delay is represented as an individual symbol. Orange dashes are the average time points of response ± SEM for these two groups. All synapses responding within 1 s of stimulus onset are represented as a single orange circle. The percentage of synapses belonging to each group is provided to the right of response time. These percentages were tested with ANOVA on ranks and Dunn’s post significance test comparing all values to WT controls. Experiments were performed on a minimum of three independent cultures for every genotype. WT nDRG neurons = 32, nsynapses = 209; CAPS DKO nDRG neurons = 35, nsynapses = 252; CAPS1 KO nDRG neurons = 38, nsynapses = 270; and CAPS2 KO nDRG neurons = 28, nsynapses = 155. ns = not significant (p > 0.05), **p < 0.01.

