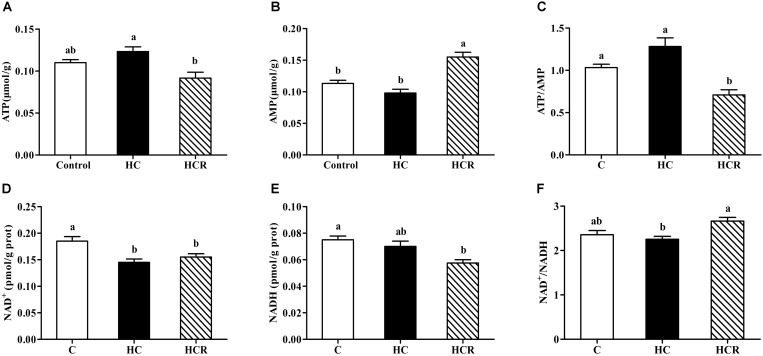
FIGURE 1.
Liver ATP contents (A), AMP contents (B), the ATP/AMP ratio (C), NAD+ contents (D), NADH (E) contents and the NAD+/NADH ratio (F) of blunt snout bream fed different experimental diets. Each data represents the mean of four replicates. Bars assigned with different letters are significantly different (P < 0.05). Control, diet with 30% carbohydrate level; HC, diet with 41% carbohydrate level; HCR, diet with 41% carbohydrate and 0.04% resveratrol. ATP, adenosine triphosphate; AMP, adenosine monophosphate; NAD+, nicotinamide adenine dinucleotide; NADH, nicotinamide adenine dinucleotide phosphate.

